Over the past several years, teen-focused jewelry retailer Claire’s Stores Inc went from filing for bankruptcy to filing for an IPO, as the company gradually expanded its offerings to attract new customers and experimented with different omnichannel strategies. Our analysis of U.S. consumer spending data since 2019 found that a higher proportion of the company’s direct-to-consumer sales have come from new customers versus returning customers. At the same time, most of Claire’s DTC sales still come from brick-and-mortar stores rather than its ecommerce site—although online sales typically spike each November, likely fueled by the company’s major Cyber Monday sale.
U.S. consumer spending data shows that most of Claire’s monthly direct-to-consumer sales come from new customers
Over the past several years, Claire’s Stores’ U.S. direct-to-consumer sales have generally been on the rise. While Claire’s sales growth was relatively consistent year-over-year in November 2022, the company’s average monthly year-over-year sales growth for the first 11 months of 2022 was 26 percent.
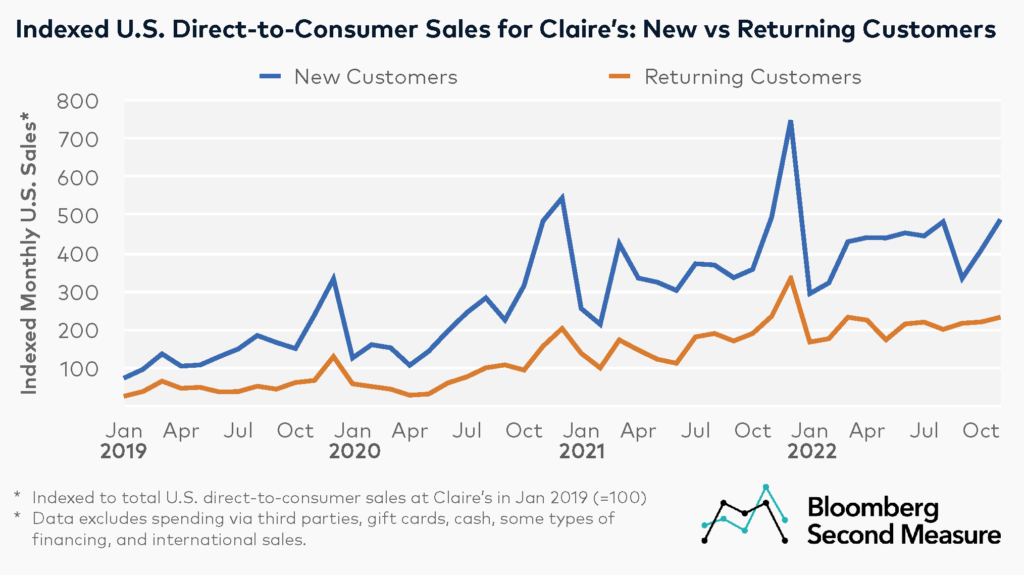
Claire’s Stores also experiences an uptick in sales each December. In December 2021, U.S. DTC sales increased 48 percent month-over-month. Sales volume in December 2021 was also roughly double the overall monthly average in 2021. Notably, Bloomberg Second Measure data only captures sales through Claire’s own stores and its website. International sales—as well as sales via gift cards, cash, and some types of financing—are excluded from this analysis.
Taking a closer look, U.S. consumer spending data reveals that most of Claire’s Stores’ DTC sales originate from new customers rather than returning customers. In November 2022, 68 percent of Claire’s sales came from new customers. Over the past few years, Claire’s Stores has introduced new offerings to increase customer retention. In late 2020, Claire’s launched its first loyalty program. In September 2021—the same month Claire’s announced it filed for an IPO—the company also launched a subscription service called Cdrop, which offers quarterly boxes or boxes for one-time purchase.
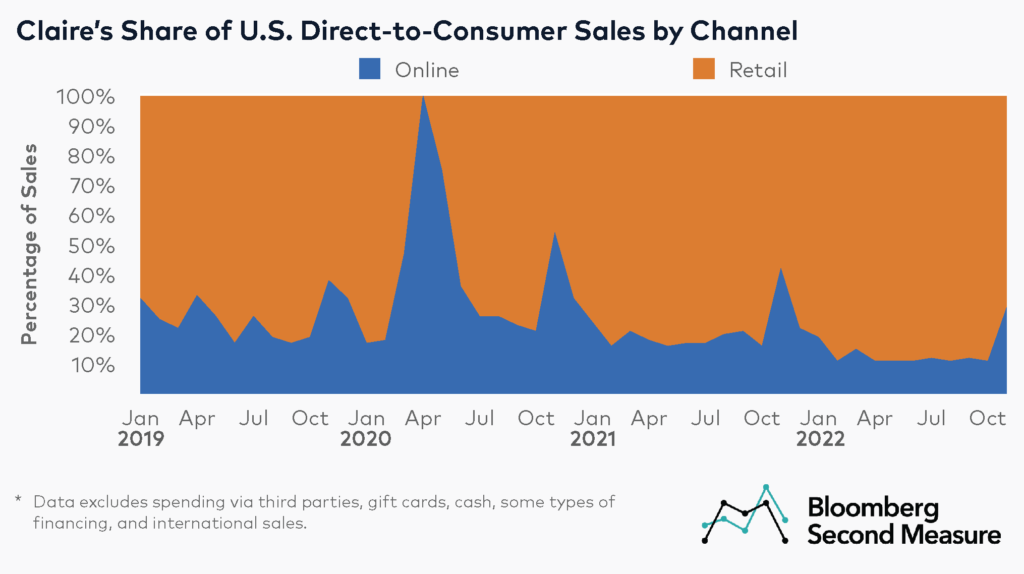
The share of online sales at Claire’s spikes each November
While primarily known as a mall brand, Claire’s Stores also sells its merchandise through its own website. Like many other retailers, the company’s sales shifted online when stores were closed in March and April of 2020.
Aside from the early months of the pandemic, most of Claire’s direct-to-consumer sales have taken place in brick-and-mortar stores. However, a higher share of Claire’s monthly sales take place online in November compared to the other months of the year. A likely factor here is that Claire’s hosts a major Cyber Monday sale every year. In November 2022, 29 percent of Claire’s sales took place online, compared to 42 percent in November 2021, 54 percent in November 2020, and 38 percent in November 2019.
Claire’s IPO date has not yet been set. In the meantime, the company has been exploring new omnichannel strategies. Earlier this year, the company introduced an option to buy online and pickup in store, and to schedule ear-piercing appointments online. Claire’s also recently joined Roblox in an effort to appeal to its target audience of Gen Z and Gen Alpha consumers.
In addition, Claire’s has collaborated with other brick-and-mortar retailers. Claire’s recently expanded its partnership with Walmart, and will be available in 2,500 Walmart stores in addition to its website (these third-party sales are excluded from our analysis). In late November, Claire’s also announced that it would open shops in some Macy’s locations.
Bloomberg Second Measure launched a new and exclusive transaction dataset in July 2022. Our data continues to be broadly representative of U.S. consumers. As a result of this panel change, however, we recommend using only the latest post in assessing metrics, and do not support referring to historical blog posts to infer period-over-period comparisons.