NOTE: Bloomberg Second Measure launched a new and exclusive transaction dataset in July 2022. Our data continues to be broadly representative of U.S. consumers. As a result of this panel change, however, we recommend using only the latest posts in assessing metrics, and do not support referring to historical blog posts to infer period-over-period comparisons.
Pandemic engagements and holiday shopping have corresponded with dazzling sales for jewelry companies, including both brands that are mostly focused on ecommerce as well as those that have historically sold through brick-and-mortar stores. Transaction data indicates that sales at newly public DTC e-tailer Brilliant Earth (NASDAQ: BRLT) have more than doubled between November 2019 and November 2021. At the same time, sales at more traditional jewelry retailers owned by Signet Jewelers (NYSE: SIG)—such as Zales, Kay Jewelers, and Jared—have resumed their seasonal patterns after an initial disruption early in the pandemic.
Among a select group of digital-first jewelry companies, Brilliant Earth has experienced the most sales growth during the pandemic
Three of the major digital-first jewelry competitors—Blue Nile, Brilliant Earth, and James Allen—have retail showrooms throughout the U.S., but are primarily known for online jewelry sales. Brilliant Earth (NASDAQ: BRLT) went public via an IPO in September 2021, while James Allen was acquired by Signet Jewelers (NYSE: SIG) in 2017.
Our transaction data shows that Brilliant Earth has experienced the most sales growth among these digitally native companies during the pandemic, starting summer 2020. Sales for Brilliant Earth jumped 70 percent between July and September of 2020 and—with the exception of a dip in January and February of 2021—have remained elevated since. Brilliant Earth sales in November 2021 were 17 percent higher than in November 2020 and 111 percent higher than in November 2019. Notably, Bloomberg Second Measure’s transaction data does not include transactions made through financing programs at jewelry companies or through BNPL.
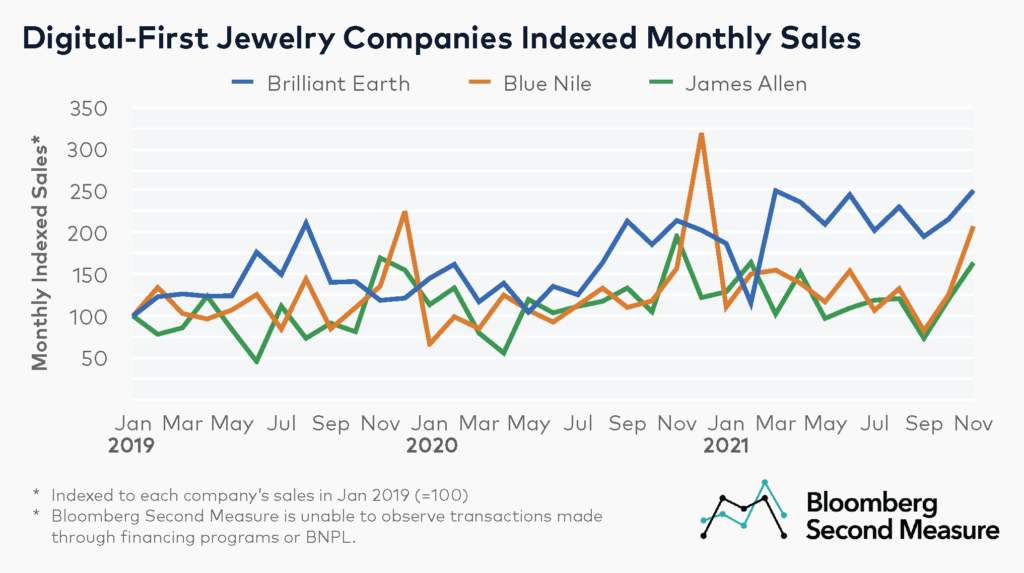
Blue Nile and James Allen follow a seasonal pattern, with higher sales during the holidays. Blue Nile experiences its sales spike in December, while James Allen has its biggest sales spike in November. In 2020, both Blue Nile and James Allen saw year-over-year growth in their biggest sales months, respectively. Blue Nile sales in December 2020 were 42 percent higher than in December 2019, and James Allen sales were 15 percent higher in November 2020 than in November 2019.
Going into the holidays in 2021, James Allen’s November sales were 16 percent lower than in 2020 and 3 percent lower than the same month in 2019. By contrast, Blue Nile’s sales have been rising, as November 2021 sales were 32 percent higher year-over-year and 53 percent higher than in November 2019.
Some traditional jewelry companies are also growing during the pandemic
Traditional jewelry companies with a strong retail presence, such as Jared, Kay Jewelers, and Zales, experience distinct sales patterns, with a large December spike corresponding with holiday sales, as well as smaller spikes in February for Valentine’s Day and May for Mother’s Day.
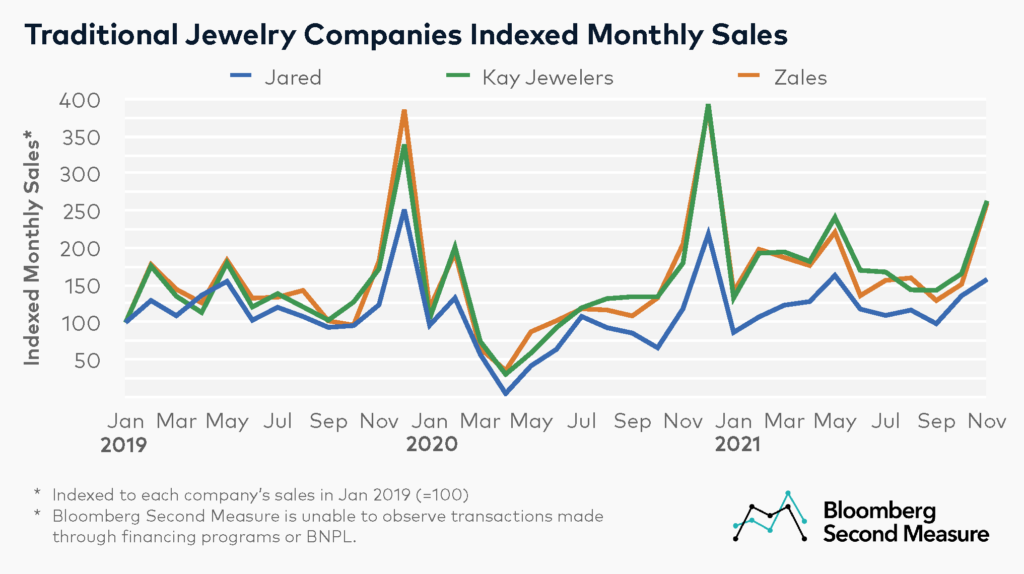
At the beginning of the pandemic, sales at all three jewelry companies in our analysis declined as shelter-in-place orders went into effect. Between February and April of 2020, sales declined 82 percent at Zales, 85 percent at Kay Jewelers, and 97 percent at Jared.
However, sales largely recovered that summer and skyrocketed again during the holidays. In December 2020, sales at Kay Jewelers increased 16 percent compared to the year before. Sales at Zales remained consistent in this time period, while sales at Jared decreased 13 percent. As with the digital-first companies, Bloomberg Second Measure’s transaction data does not include purchases made through financing programs at these companies or through BNPL.
Jared, Kay Jewelers, and Zales are subsidiaries of Signet Jewelers (NYSE: SIG), whose CEO reportedly anticipated an early holiday shopping season in 2021. Our analysis of transaction data from U.S. consumers shows that November 2021 sales were up 27 percent year-over-year at Zales, 33 percent at Jared, and 47 percent at Kay. Notably, Signet Jewelers has been consolidating more of the jewelry industry over the past year, acquiring jewelry subscription service Rocksbox in April 2021 and more recently acquiring Diamonds Direct in November 2021.
Consumers are spending more at digital-first jewelry companies
Our analysis of transaction data for these DTC jewelry brands found that Brilliant Earth and James Allen have the highest average transaction values. In November 2021, the average transaction values at these companies were $2,433 and $2,436, respectively. A likely reason for the higher average transaction values at these companies is that their main products are custom engagement rings and fine jewelry, which carry higher price points.
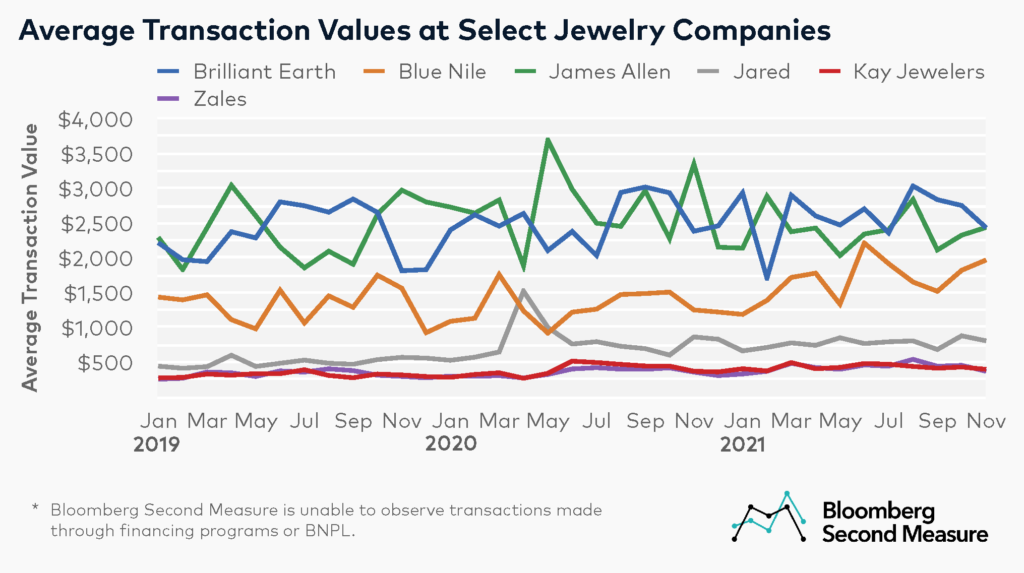
On the other hand, average transaction values are lower at the traditional jewelers such as Zales, Kay Jewelers, and Jared. In November 2021, the average transaction values at these companies were $368, $395, and $805, respectively. To differentiate its jewelry brands, Signet Jewelers has positioned Jared as its luxury brand (reflected in its higher average transaction value), while both Kay and Zales cater to the mid-range of the jewelry market—with Kay’s emphasis on products for gifting, and Zales’ emphasis on fashion and statement jewelry for self-purchasing.
Interestingly, these traditional jewelry companies are experiencing elevated average transaction values compared to before the pandemic. For every month in 2021, average transaction values at Kay Jewelers, Zales, and Jared were higher than the same month in 2019.
*Note: Bloomberg Second Measure regularly refreshes its panel and methods in order to provide the highest quality data that is broadly representative of U.S. consumers. As a result, we may restate historical data, including our blog content.