NOTE: Bloomberg Second Measure launched a new and exclusive transaction dataset in July 2022. Our data continues to be broadly representative of U.S. consumers. As a result of this panel change, however, we recommend using only the latest posts in assessing metrics, and do not support referring to historical blog posts to infer period-over-period comparisons.
Dick’s Sporting Goods Inc (NYSE: DKS) knocked it out of the park in the fourth quarter of 2021, reporting another earnings beat. Consumer transaction data shows that most sales for the sports retailer over the past several years have continued to originate from in-store purchases, rather than a shift to ecommerce. Our analysis of in-store and online consumer spending trends at Dick’s Sporting Goods Inc also found that throughout the COVID-19 era, average transaction values for the retail channel have exceeded those from online purchases.
Most sales for Dick’s Sporting Goods Inc (NYSE: DKS) came from in-store spending
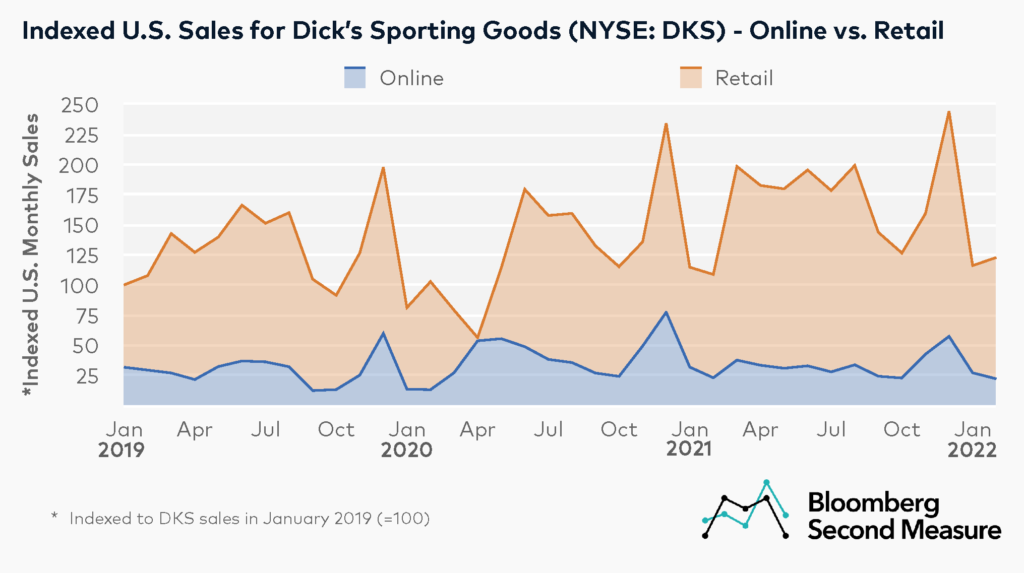
After an initial dip in March and April of 2020, U.S. sales at Dick’s Sporting Goods and its subsidiaries increased as demand for outdoor gear, activewear, and sporting equipment soared. In fact, sales recovery for the outdoor goods industry outpaced the overall retail industry in the early months of the pandemic. Dick’s Sporting Goods Inc kept the ball rolling through the first few months of 2022, as February sales were 13 percent higher year-over-year and 19 percent higher than in February 2020.

Dick’s Sporting Goods stores temporarily closed early in the pandemic, likely impacting the growth rates for both retail and online sales. In 2020, the average monthly year-over-year sales growth was 41 percent for online sales, but -13 percent for retail sales. However, as stores gradually reopened, the retail channel experienced stronger year-over-year sales growth than the online channel for every month since March 2021. In February 2022, retail sales for Dick’s Sporting Goods Inc were 17 percent higher year-over-year. Within the same time frame, online sales decreased 4 percent.
Furthermore, an analysis of share of sales by channel shows that with the exception of April 2020—when Dick’s Sporting Goods stores were closed—most monthly sales over the past three years came from in-store spending rather than online spending. In February 2022, 82 percent of sales at Dick’s Sporting Goods Inc took place in stores.
Notably, in August 2019, Dick’s Sporting Goods Inc sold off its sports technology company Affinity Sports as well as Blue Sombrero, part of its Team Sports HQ brand that had previously contributed to online sales.
Throughout the pandemic, average transaction values at Dick’s Sporting Goods Inc have been higher for in-store sales
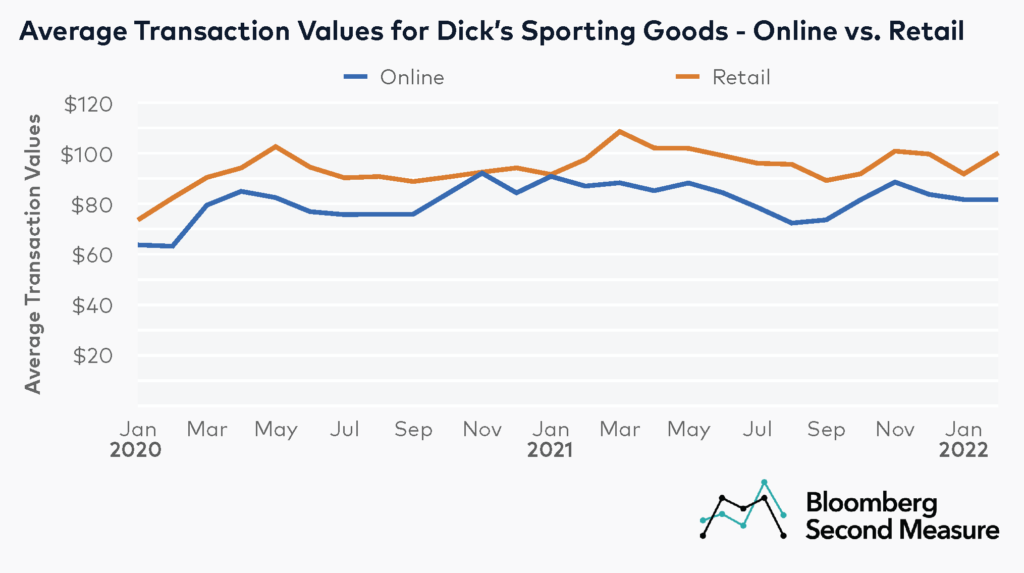
Looking at in-store and online consumer trends, retail customers at Dick’s Sporting Goods Inc have been spending more than online customers during the pandemic. In February 2022, in-store shoppers spent an average of $100 per transaction, while online shoppers spent $82.

Another trend is that average transaction values have been climbing for both purchase channels over the past two years. Compared to the same month in 2020, average transaction values in February 2022 were 29 percent higher for online shopping and 22 percent higher for retail.
In recent years, Dick’s Sporting Goods Inc has debuted new store concepts like its experiential House of Sport locations, which offer features like rock climbing walls and batting cages, as well as off-price branches like Overtime by Dick’s Sporting Goods. The sporting goods retailer also expanded its private label offerings sold in stores and online, including a men’s athleisure line.
Dick’s Sporting Goods Inc’s reported earnings consistently beat investor expectations in 2021, impacted by factors like the return of kids’ team sports, demand for home fitness products, and the company’s broad array of athletic and outdoor products. As the spring and summer months get underway, the question remains: will Dick’s Sporting Goods Inc hit another home run in 2022?
*Note: Bloomberg Second Measure regularly refreshes its panel and methods in order to provide the highest quality data that is broadly representative of U.S. consumers. As a result, we may restate historical data, including our blog content.
