Following a reported sales slowdown in its second fiscal quarter, department store chain Dillard’s Inc (NYSE: DDS) exceeded investors’ expectations with the release of its third quarter earnings report. Prior to the Q3 earnings surprise announcement, transaction data from Bloomberg Second Measure projected Dillard’s third quarter revenue within 1 percent of the company’s reported revenue.
Bloomberg Second Measure’s scaled revenue projection for Dillard’s (NYSE: DDS) came within 1 percent of reported revenue in FY22 Q3
On November 10, 2022, Dillard’s Inc announced that its reported revenue for the fiscal quarter ending on October 29, 2022 (FY22 Q3) was $1.57 billion. Bloomberg Second Measure transaction data projected $1.56 billion in revenue–coming within 1 percent of reported revenue—while the mean consensus was 6 percent lower than reported revenue, at $1.48 billion.
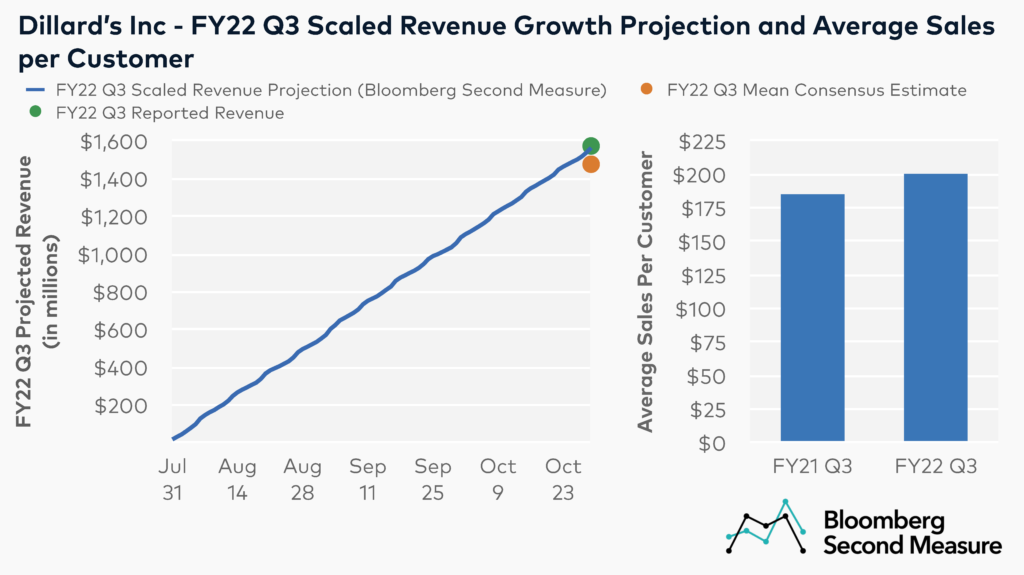
Interestingly, the full consensus range for Dillard’s for FY22 Q3 was between $1.427 billion and $1.514 billion—below Dillard’s reported revenue as well as Bloomberg Second Measure’s scaled revenue projection.
Transaction data further shows that higher per-customer spending may have been a factor in Dillard’s earnings surprise. Customers spent $200 on average in the third fiscal quarter of 2022, an 8 percent increase in quarterly sales per customer compared to the third fiscal quarter of 2021. However, this was partially offset by a 6 percent decline in customer counts in the same period.
Looking forward to FY22 Q4, Dillard’s sales volume is typically highest in December
Similar to fashion retailers, Dillard’s experiences a notable spike in sales at the end of the year, corresponding with the holiday shopping season. Transaction data shows that Dillard’s sales increased 79 percent between November and December of 2021, 107 percent between November and December of 2020, and 75 percent between November and December of 2019. Furthermore, December sales have accounted for a higher percentage of annual sales at Dillard’s during the COVID era. December sales accounted for 16 percent of annual sales in 2021, 18 percent in 2020, and 14 percent in 2019.
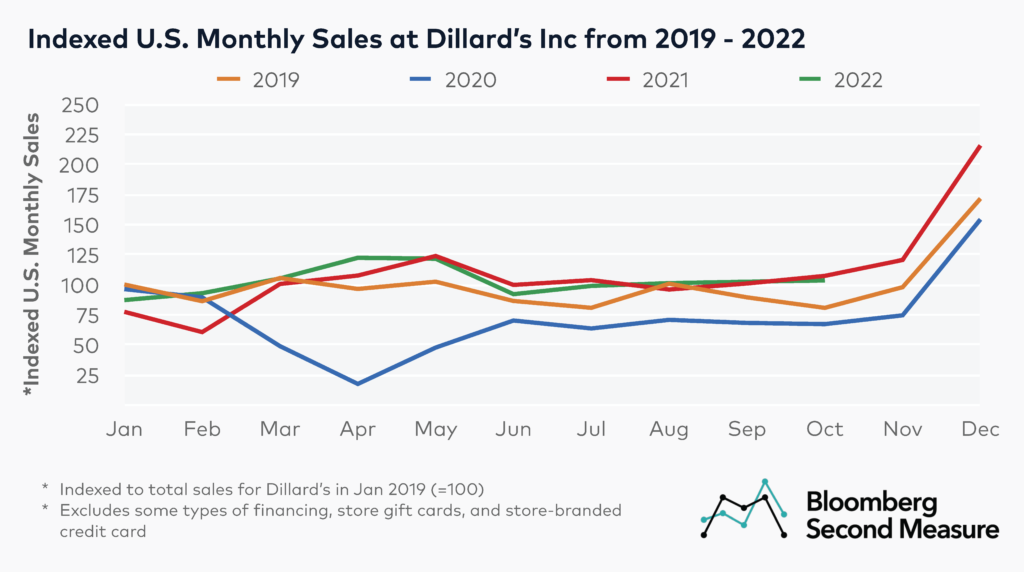
Looking at more recent sales trends, month-over-month sales remained relatively steady from August through October of 2022. In October 2022, Dillard’s sales were down 4 percent year-over-year, but up 28 percent compared to the same month in 2019.
Bloomberg Second Measure launched a new and exclusive transaction dataset in July 2022. Our data continues to be broadly representative of U.S. consumers. As a result of this panel change, however, we recommend using only the latest post in assessing metrics, and do not support referring to historical blog posts to infer period-over-period comparisons.