NOTE: Bloomberg Second Measure launched a new and exclusive transaction dataset in July 2022. Our data continues to be broadly representative of U.S. consumers. As a result of this panel change, however, we recommend using only the latest posts in assessing metrics, and do not support referring to historical blog posts to infer period-over-period comparisons.
U.S. consumer spending has been altered by the coronavirus pandemic. Our data reveals that consumers are changing the way they pay for goods and services, with some industries seeing spending shift toward online purchases. Additionally, the pandemic has changed the types of purchases consumers are making, with stimulus recipients increasing their spending on big-ticket items. By analyzing industry-level data, consumer spending trends can provide insight into which sectors of the economy are recovering fastest.
Overall, consumer spending in June 2021 was up 20 percent versus the same month in 2020 across all sectors, an aggregation of over 5,200 major U.S. companies. Compared to May, June’s year-over-year growth is 6 percentage points lower.
The following data stories represent snapshots of how different industries fared between spring 2020 and spring 2021, during the height of the pandemic. This analysis does not include sales at local brick and mortar retailers, business-to-business sales, or cash transactions—all of which may be more impacted by COVID-19.
Amusement parks see sales rise one year into the pandemic
In March 2020, theme parks such as Six Flags, Disney, and Sea World closed due to shelter-in-place orders, causing industry sales to drop over the following months. However, amusement park sales have jumped significantly—likely due to the phased reopenings since summer 2020 and increased vaccination rates in 2021. As of April 2021, amusement park industry sales are up 725 percent year-over-year.
Zooming in on a few of the country’s largest amusement parks, Six Flags fared better than its competitors in the early months of the pandemic. This may be in part due to Six Flags’ monthly membership option, which remained active during COVID-19, while competitors typically offer day tickets or annual passes. Most theme parks in the chosen competitive set experienced slight sales increases throughout the summer and fall, and all had a significant spike in sales between February and March 2021. As of April 2021, Busch Gardens’ average monthly year-to-date sales is 145 percent higher than it was a year ago. Going into summer 2021, theme parks are continuing to update their safety protocols and expand their reopening guidelines.
Fashion retail sales see explosive growth one year after shelter-in-place
Clothing stores suffered early on in the pandemic, as brick-and-mortar locations were forced to close. In March 2020, overall sales among the largest clothing, accessory, and shoe retailers collectively dropped -42 percent year-over-year, declining even further the following month to -49 percent year-over-year. Despite a gradual recovery over the summer and fall, monthly year-over-year sales growth in 2020 averaged -12.3 percent.
Year-over-year sales growth skyrocketed in March 2021, likely buoyed by increased vaccination rates and the latest round of stimulus funds. For the largest clothing, accessory, and shoe retailers, year-over-year sales growth in March 2021 reached 104 percent. Some types of clothing retailers fared particularly well during the pandemic, specifically athleisure. However, return-to-office plans may affect demand for professional apparel in the coming months.
Sales for the child care industry are gradually recovering
Child care companies, which include daycare facilities and babysitting services, have struggled throughout the pandemic. Enrollment has decreased in the wake of shelter-in-place orders and school closures, while operating costs related to sanitation have risen. Consumer transaction data shows that industry sales declined 57 percent from February to March 2020 before reaching their lowest point in April. At a more granular level, Sittercity and Wonderschool fared better than other competitors in the early months of the pandemic. Tinkergarten and The Learning Experience also saw a significant spike in sales in February, before stay-at-home orders went into effect.
Child care services began experiencing a slow, but steady recovery in the early summer months. With the exception of November, industry sales have increased every month since May. Despite the continued growth, child care sales are still lagging compared to before the pandemic. As of February 2021, industry sales are -31 percent year-over-year. To support the struggling industry, the recent American Rescue Plan Act has earmarked $39 billion for child care providers.
Gyms remain among the hardest hit industries
Because gyms have traditionally relied on brick-and-mortar sales, they have been significantly impacted during COVID-19. Throughout 2019, gyms experienced positive year-over-year growth, averaging 7 percent. However, many gyms and fitness clubs were forced to temporarily close their doors early in 2020 as lockdowns went into effect. In April and May of 2020, overall sales at top gyms plummeted -86 percent year-over-year.
Sales began to recover over the summer as shelter-in-place orders were lifted, but still have not reached their pre-pandemic levels. Year-over-year growth has averaged -37 percent since July 2020, rising to -33 percent in January 2021. Despite lagging gym sales through the end of 2020 and into 2021, consumers aren’t necessarily giving up on their fitness-related New Year’s resolutions. At-home workouts and digital fitness subscriptions have experienced renewed interest throughout the pandemic, and several gyms have expanded their online offerings to meet demand.
Growth has fluctuated in finance and insurance spending
The finance and insurance industry has seen volatility throughout 2020. Year-over-year growth in October was 71 percent, compared to 83 percent in September. Much of this growth can be attributed to increased spending for commodity contracts dealing, which is defined as establishments that buy and sell futures commodity contracts like precious metals, foreign currency, oil, or agricultural products. Growth was especially pronounced for Coinbase, which grew about 250 percent year-over-year in October.
Commodity contracts dealing and securities brokerages have experienced significant fluctuations over the past several months. In March, the market instability and financial uncertainty—presumably from the pandemic—precipitated a 243 percent year-over-year increase in transactions for commodity contracts and a 218 percent year-over-year increase in spending for securities brokerages. By contrast, growth at insurance carriers (excluding life and health insurance) has remained more modest throughout the year, hovering between 11 and 17 percent.
Pet supply companies showing steady growth since summer
As animal shelters nationwide face soaring demand for pet adoption, demand for pet supplies has also surged. Pet care and supplies stores, in aggregate, have enjoyed steady growth since the beginning of summer.
Last month, pet supply stores saw 19 percent year-over-year growth, up from 16 percent in August. Within the industry, e-commerce companies with little to no brick-and-mortar presence have led the pack. Chewy, an online pet supplies retailer, observed year-over-year growth of 37 percent in September while Petco, which has more than 1,500 brick-and-mortar stores nationwide, observed 10 percent growth.
Demand increasing for local delivery services
Local delivery sales rose 23 percentage points year-over-year from June to July of this year. This spike was most pronounced in the final week of June, when year-over-year sales growth jumped to 158 percent from 120 percent the week before.
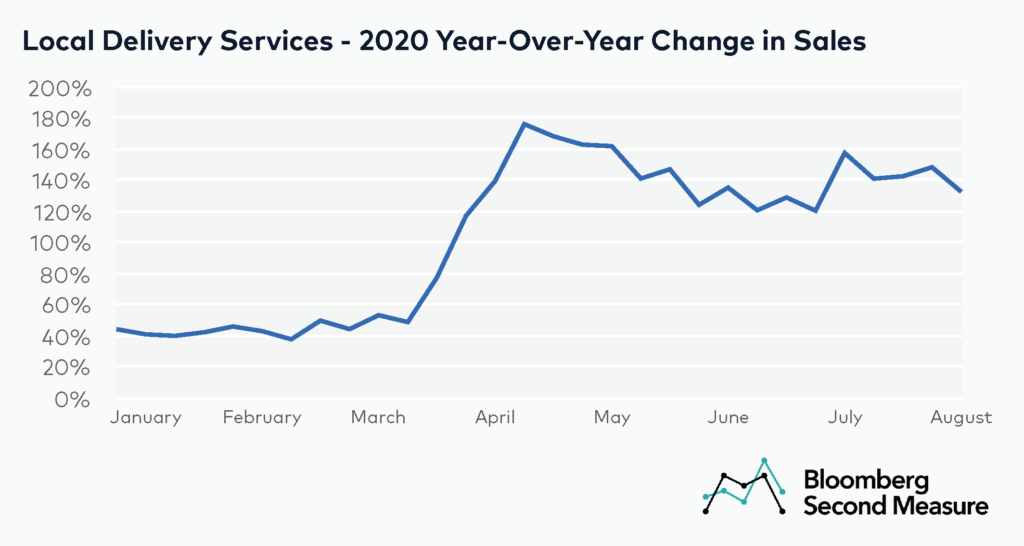
This was sustained through July, as the month saw weekly year-over-year growth of more than 140 percent, before dipping slightly to 132 percent in the final week of the month. July also marks the first month since April to have an increase in year-over-year sales nearing initial shelter-in-place levels. Growth had been declining since May with the re-opening of states nationwide.
Despite initial blowout sales, hair salons are seeing tamer growth
Hair salons and barbershops throughout most of America were severely impacted by nationwide shelter-in-place orders. Year-over-year sales were down 98 percent in April, a stark contrast to the 11 percent growth the industry demonstrated in January of this year. Then in May, the industry bounced back rapidly, especially in states where shelter-in-place orders were lifted earlier than the rest of the country.
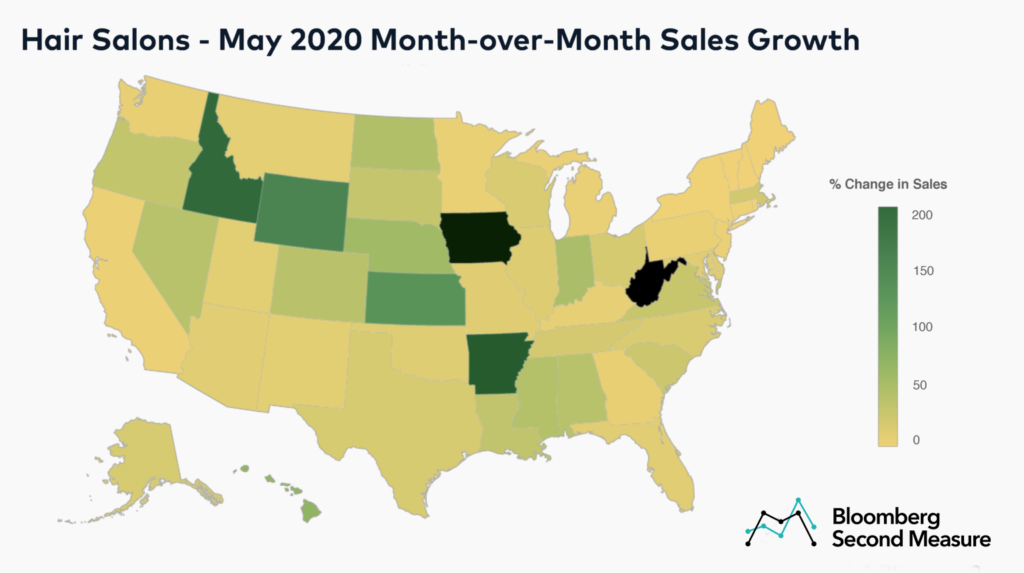
Month-over-month sales surged in midwest and northwest states, with Idaho, Arkansas, West Virginia, and Iowa observing upwards of 200 percent growth. States like California and New York, which were among the hardest hit by shelter-in-place orders, observed little to no growth between April and May. However, sales in these states gained momentum in June, posting modest month-over-month growth in sales.
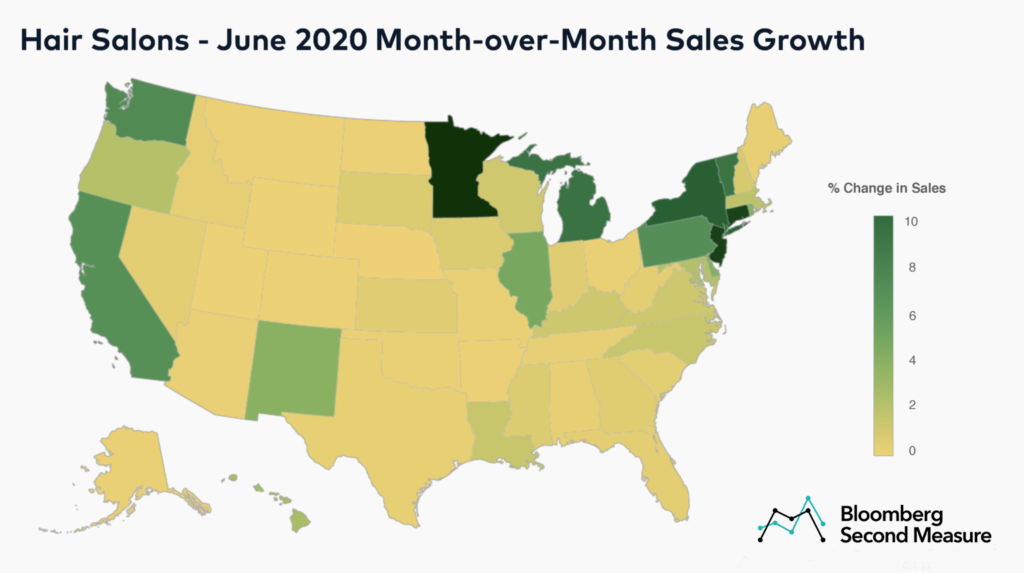
Minnesota leads the pack with 15 percent month-over-month sales growth in June. States in the northeast, including Connecticut, New Jersey, and New York all grew more than 10 percent, while California and Washington observed month-to-month growth of 7 percent.
Some parts of the transportation industry are recovering faster than others
The airline industry was one of the first to feel the effects of COVID-19. During the week beginning on March 30, sales in the airline industry reached their lowest point relative to 2019. That week, sales were down 93 percent versus the same week the year prior. Other segments of the transportation industry, like rideshare, soon followed in decline. The rideshare industry had its worst performing week relative to 2019 just one week later, with sales down 91 percent.
However, the airline industry has also been one of the first to bounce back. During the month of April, sales were approximately 8 percent of what they were in 2019. In contrast, sales in the first half of May, were nearly 15 percent of what they were in the same period in 2019. This represents a 75 percent increase between months.
Other segments of the transportation industry have yet to show the same degree of recovery. For example, rideshare sales only rebounded roughly 20 percent between the start of April and May 17. Given that flights are typically paid for in advance of travel, these findings may indicate travelers feel confident booking a trip later in the year or further into the future, even if they’re unwilling to travel at present.
Home improvement spending increases as consumers stay home
With people spending more time at home, the home improvement industry has seen major growth during the pandemic. Hardware stores have consistently shown positive year-over-year growth every week since March 16. Additionally, average transaction values appear to have peaked in April and are still elevated vs. pre-pandemic values.
Purchase totals at hardware stores first started climbing in early March, rising 8 percent in a single week. Most notably, during the week of April 13—around the same time stimulus checks first went out—they reached a peak value of $110 and have remained around $100 since.
*Note: Bloomberg Second Measure regularly refreshes its panel and methods in order to provide the highest quality data that is broadly representative of U.S. consumers. As a result, we may restate historical data, including our blog content.