With holiday shopping in full swing, several retailers—including department stores like Kohl’s and big-box stores like Target—are reportedly bracing for deep discounts in response to excess inventory and value-conscious consumers. At the same time, off-price retailers are reportedly benefitting from the inventory challenges faced by their suppliers, and have been able to negotiate lower buying prices and further diversify the brands in their merchandise. Our analysis of the off-price retail industry—which includes The TJX Companies (NYSE: TJX), Ross Stores Inc (NASDAQ: ROST), and Burlington Stores Inc (NYSE: BURL)—found that TJX leads the pack in terms of market share and per-customer spending. As the holiday fiscal quarter gets underway, Bloomberg Second Measure also found that all three off-price retailers have historically experienced a noticeable spike in sales and per-customer spending in December.
Within the off-price retail industry, The TJX Companies (NYSE: TJX) holds the highest market share
The highest off-price retail market share goes to The TJX Companies, which earned 68 percent of sales among the three major competitors in October 2022. In its U.S. portfolio of brands, The TJX Companies owns T.J. Maxx, Sierra Trading Post, HomeGoods, Marshalls, and Homesense. Ross Stores Inc, which is composed of Ross Stores and dd’s Discounts, came in second with 22 percent of sales in October 2022. Burlington Stores Inc had 10 percent of sales.
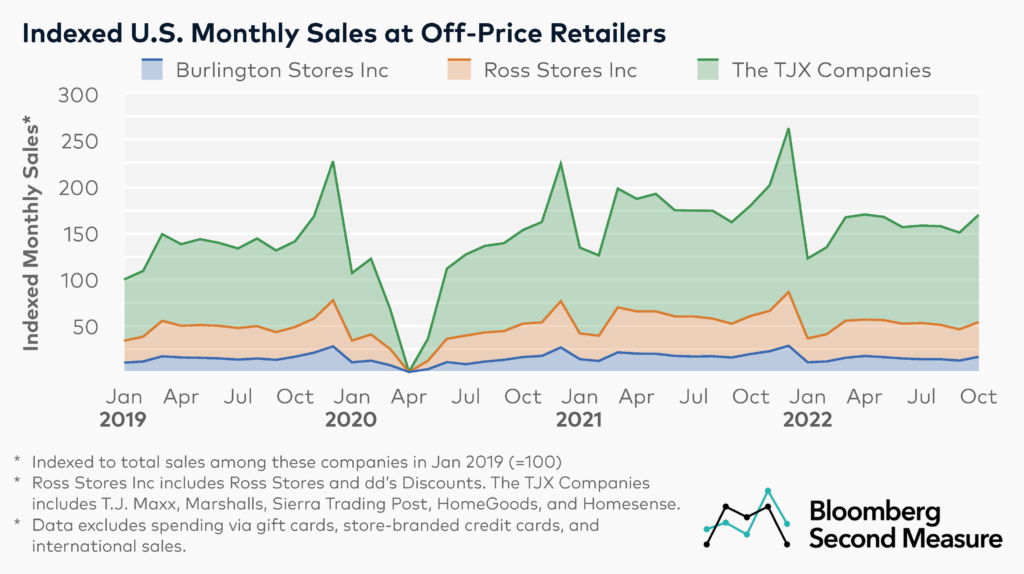
Looking at seasonal patterns, off-price retailers typically see their highest monthly sales in December of each year. Between November and December of 2021, sales increased 34 percent at Ross Stores Inc, 30 percent at The TJX Companies, and 26 percent at Burlington Stores, Inc. The off-price retail industry is also seeing elevated sales compared to pre-pandemic levels. In October 2022, combined sales among these off-price retailers were 20 percent higher than the same month in 2019.
Unlike other retailers such as big-box and department store chains, most off-price retailers have not introduced online shopping as a channel (which likely accounts for the decline in sales in April 2020, when stores were closed due to the pandemic). Bucking this trend, TJX-owned HomeGoods launched its first ecommerce site in September 2021.
Some department store companies also have their own subsidiaries for discounted merchandise—most notably, Nordstrom Rack and Saks OFF Fifth, both of which have ecommerce sites as well as some retail stores. Our analysis only includes the larger off-price, public parent companies that primarily rely on in-store sales.
How does monthly per-customer spending compare among off-price retailers?
The TJX Companies also has the highest average monthly sales per customer among the major off-price retailers. In October 2022, customers spent $98 on average at The TJX Companies, $78 at Burlington Stores Inc, and $77 at Ross Stores Inc. Notably, Burlington Stores Inc and Ross Stores Inc mainly sell apparel, while The TJX Companies also has subsidiaries that offer home decor and furnishings, which may partially account for the higher average spend.
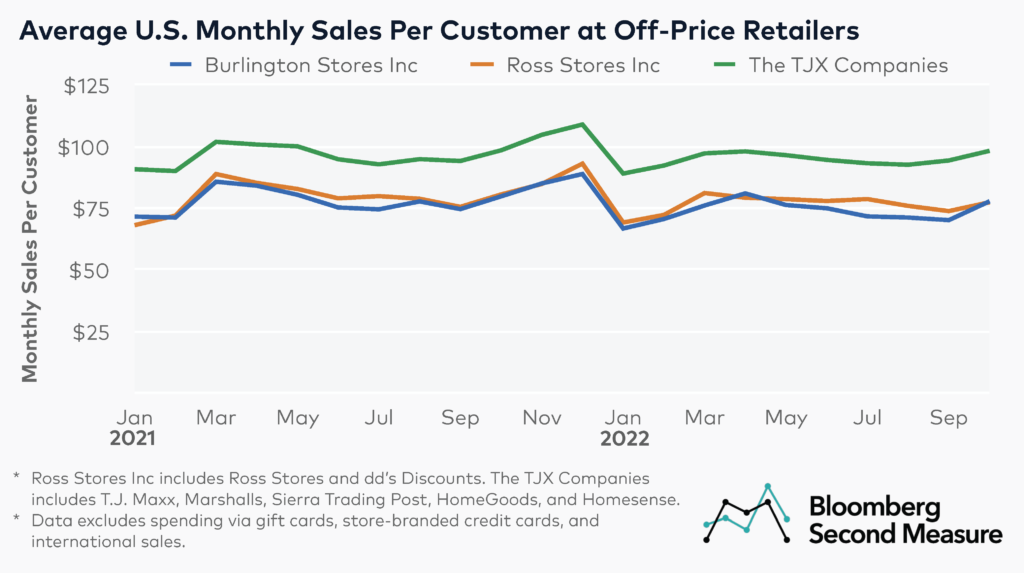
For most months in 2022, the average monthly sales per customer at each off-price retailer has declined or remained consistent year-over-year. In October 2022, the average monthly sales per customer declined 4 percent year-over-year at Ross Stores Inc and 2 percent at Burlington Stores Inc. Average per-customer spend remained about the same year-over-year at The TJX Companies.
In 2021, all three off-price retailers experienced their highest average monthly sales per customer in December, with $109 at The TJX Companies, $93 at Ross Stores Inc, and $89 at Burlington Stores Inc.
Bloomberg Second Measure launched a new and exclusive transaction dataset in July 2022. Our data continues to be broadly representative of U.S. consumers. As a result of this panel change, however, we recommend using only the latest post in assessing metrics, and do not support referring to historical blog posts to infer period-over-period comparisons.