NOTE: Bloomberg Second Measure launched a new and exclusive transaction dataset in July 2022. Our data continues to be broadly representative of U.S. consumers. As a result of this panel change, however, we recommend using only the latest posts in assessing metrics, and do not support referring to historical blog posts to infer period-over-period comparisons.
Dutch Bros Coffee, the Oregon-based coffee chain popular on the West Coast, recently made its debut on the NYSE under the ticker BROS. In the two years leading up to its IPO, Dutch Bros launched market expansion plans aimed at reaching consumers in new states. An analysis of consumer transaction data found that Dutch Bros Coffee’s overall sales have more than doubled over the past two years, driven by significant growth in states where it already had a strong presence, as well as increasing sales in states, such as Texas, in which the company recently opened newer locations.
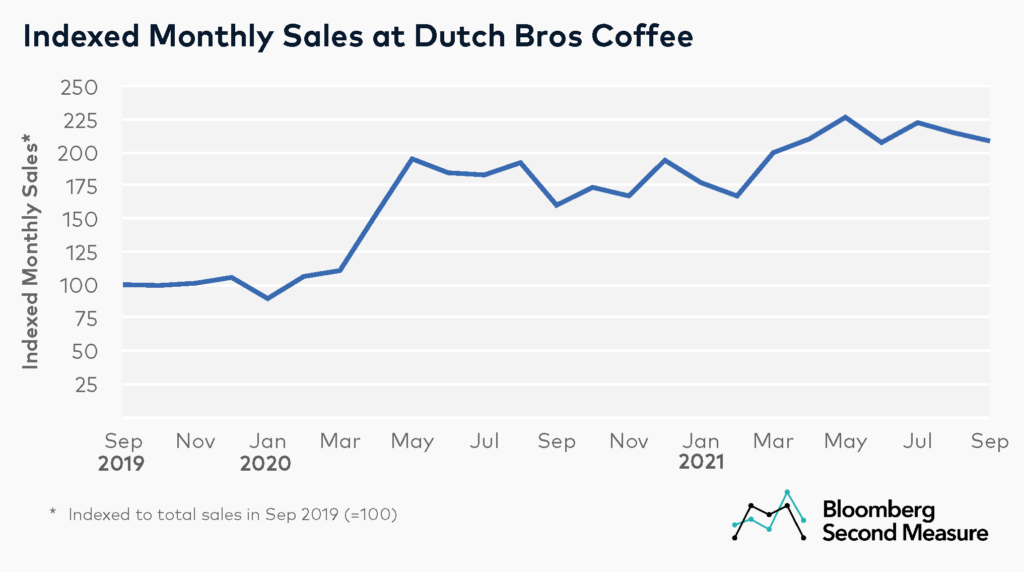
The chain, which has many locations with drive-thrus, saw a major boost early in the pandemic, as overall sales grew 38 percent between March 2020 and April 2020. Since then, sales have continued to rise. Between September 2019 and September 2021, Dutch Bros sales grew 109 percent. By contrast, major coffee shop competitors Starbucks and Dunkin saw sales dip at the beginning of the pandemic as many retail locations temporarily closed.
Dutch Bros sales growth was primarily driven by significant sales increases in established markets, but newer markets like Texas are also contributing to growth
As of September 2021—the month of its IPO—Dutch Bros Coffee had retail locations in 13 states, mostly concentrated on the West Coast and in the Southwest. Sales in all of these states experienced strong growth over the past two years. In Oregon, where the company was founded in 1992, sales grew 30 percent between September 2019 and September 2021. California sales nearly doubled in the same time period, while sales in Arizona grew 148 percent. Among states with at least 5 Dutch Bros Coffee retail locations, California, Oregon, and Arizona accounted for 22 percent, 19 percent, and 16 percent of the company’s sales, respectively, in September 2021.
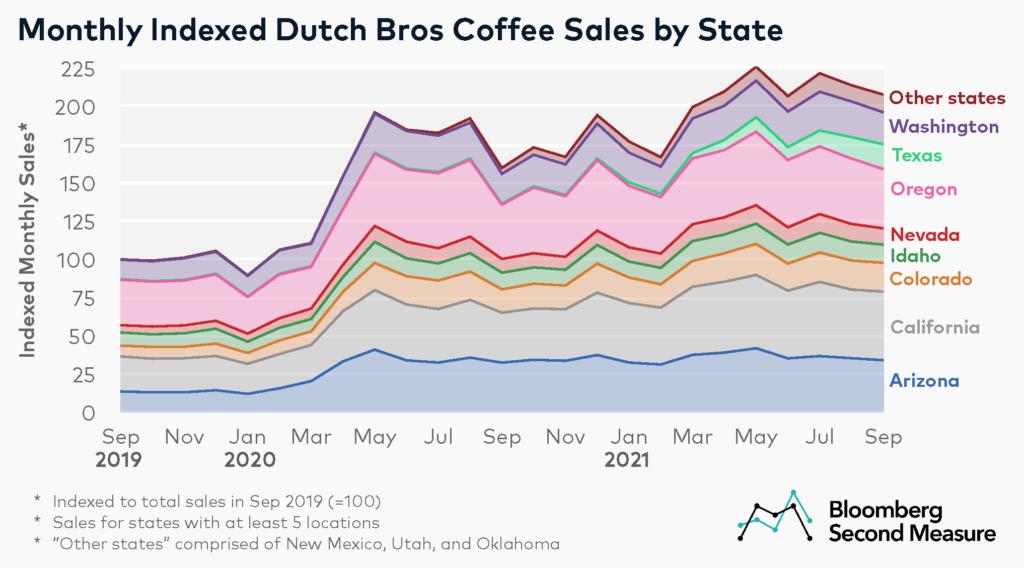
Throughout the pandemic, Dutch Bros has been expanding into new markets, specifically Utah and New Mexico in 2020 followed by Texas and Oklahoma in 2021. Dutch Bros experienced particularly strong sales growth in Texas, with monthly sales increasing 587 percent since opening its first location in College Station in January 2021 and subsequently expanding operations to other Texas metro areas. In September 2021, Texas accounted for 8 percent of Dutch Bros sales among the states in our analysis. The other new markets—Utah, New Mexico, and Oklahoma—collectively accounted for 6 percent of sales that same month.
How do average transaction values at Dutch Bros compare to Starbucks and Dunkin?
At the same time that Dutch Bros has been launching coffee shops in new states, its average transaction value has increased and is now closer to that of competitor Starbucks. In September 2021, Dutch Bros’ average transaction value was $11, compared to $13 for Starbucks and $9 for Dunkin. Dutch Bros’ average transaction value in September 2021 was 15 percent higher than the year before and 33 percent higher than in September 2019. By contrast, Starbucks’ average transaction value in September 2021 decreased 2 percent year-over-year, but was 14 percent higher than in September 2019.
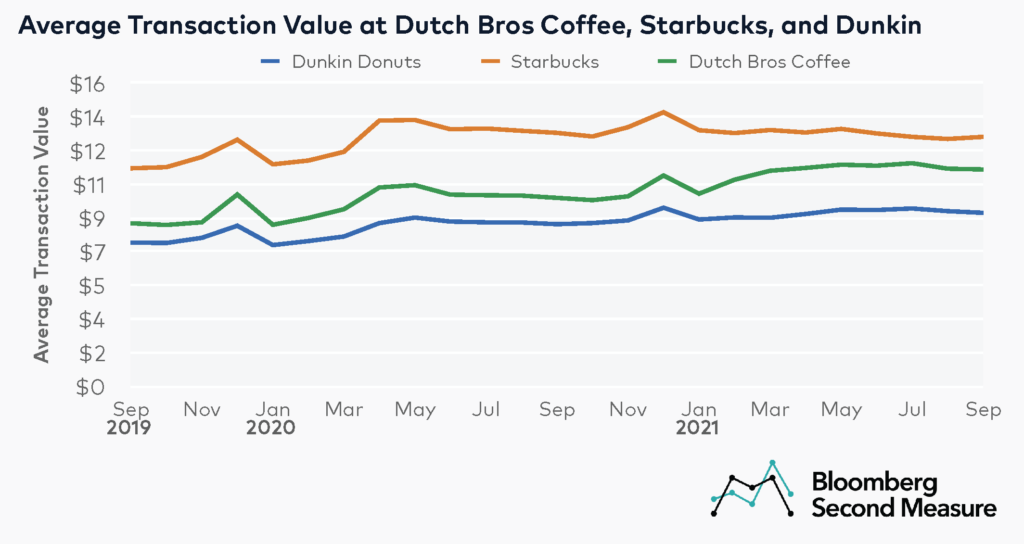
Interestingly, Dutch Bros, Dunkin, and Starbucks all experienced an increase in average transaction value at the beginning of the pandemic, with respective month-over-month increases of 12 percent, 9 percent, and 13 percent. All three coffee companies also saw a slight uptick in average transaction value in December 2019 and December 2020, likely due to consumers purchasing gift cards or other merchandise for the holidays.
*Note: Bloomberg Second Measure regularly refreshes its panel and methods in order to provide the highest quality data that is broadly representative of U.S. consumers. As a result, we may restate historical data, including our blog content.