NOTE: Bloomberg Second Measure launched a new and exclusive transaction dataset in July 2022. Our data continues to be broadly representative of U.S. consumers. As a result of this panel change, however, we recommend using only the latest posts in assessing metrics, and do not support referring to historical blog posts to infer period-over-period comparisons.
The return of the pumpkin spice latte—or “PSL” to its loyal fans—is heralded as the unofficial start of fall. Starbucks and Dunkin are two of the largest coffee chains known for selling this seasonal treat. But does the return of the PSL affect sales at these two companies? Consumer transaction data found no major changes in week-over-week sales when Dunkin introduced its fall 2021 beverages, while Starbucks experienced a modest sales bump the same week that PSLs returned to its menu.
Starbucks sales increase the same week that pumpkin spice lattes launch
Starbucks launched its first iteration of the pumpkin spice latte back in 2003, but it wasn’t until 2020 that Dunkin’s PSL made its debut in the fall beverage lineup. The launch date for fall drinks at these coffee companies has been generally creeping earlier over the past few years, starting in late August rather than September. In 2021, the pumpkin spice latte was added to the Starbucks menu on August 24, while Dunkin began offering its PSL on August 18.
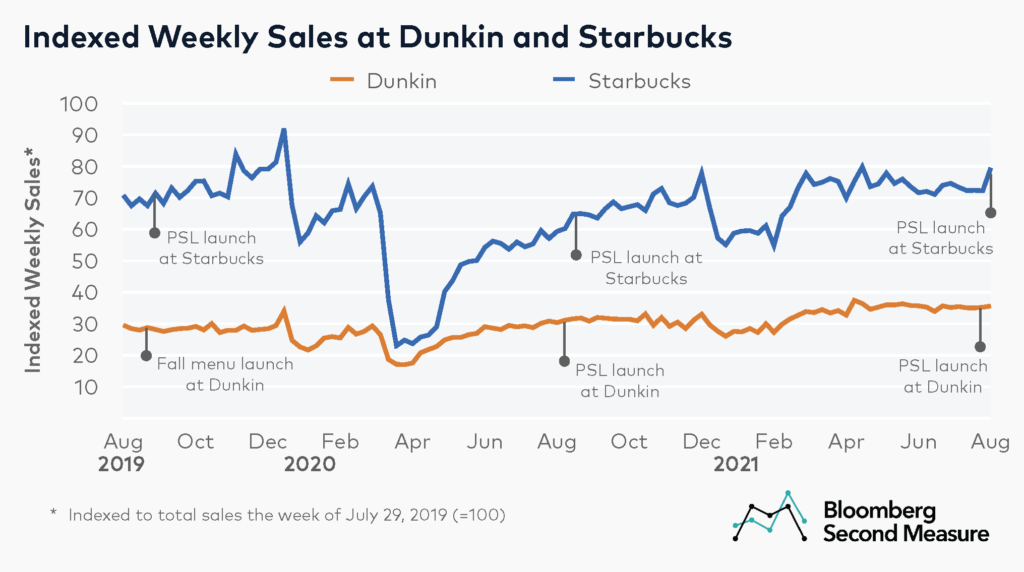
Despite the earlier launch date, Dunkin did not experience significant sales growth at the start of PSL season. The week including August 18, 2021, Dunkin’s sales remained consistent with weekly sales during the summer months, increasing only 1 percent week-over-week. By contrast, Dunkin sales increased 3 percent week-over-week when the fall beverages launched in 2020 and 2019.
The “PSL effect” is more pronounced at Starbucks. In 2021, Starbucks experienced a noticeable uptick in sales the week including August 24, with sales increasing 10 percent week-over-week. After summer sales remained relatively flat, the week of August 24 represented the biggest jump in weekly sales since spring. Similarly, Starbucks sales increased 8 percent week-over-week when the PSL returned to menus in 2020 and increased 6 percent week-over-week in 2019.
Another notable trend is that both coffee companies tend to experience lower sales at the beginning of the year and higher sales toward the end of the year. The exception was March and April of 2020, when sales plummeted as shelter-in-place orders went into effect and many locations temporarily closed or offered drive-thru and pickup only. Starbucks in particular follows an annual pattern in which observed sales dip in January, gradually grow from February onward, and peak in December. A likely factor in the December sales boom is that customers are buying gift cards and coffee-related gifts. The January crash may be attributed to consumers spending their holiday gift cards or New Year’s Resolutions to eat healthier or save money.
Starbucks reigns nationwide, but Dunkin has a stronger presence in New York and Pennsylvania
When looking at combined sales between the two coffee companies, Starbucks has the larger share of sales nationwide, with 68 percent in August 2021. While Starbucks is the biggest national coffee chain, Dunkin has a greater share of sales in some states, especially in the Northeast. In August 2021, Dunkin’s share of sales between the two companies in New York state was 56 percent. In Pennsylvania, it was 52 percent. Dunkin’s share of sales is also above the national average in Illinois, Georgia, Florida, and Ohio.
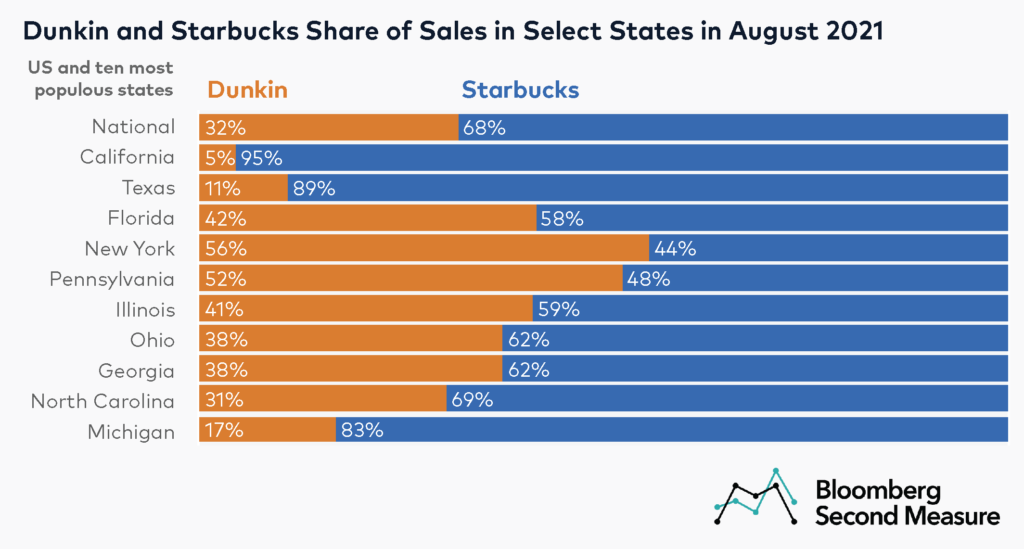
By contrast, Dunkin has a much smaller presence in California and Texas, with 5 percent and 11 percent of sales between the two companies, respectively. Dunkin also has a limited presence across the West, with no locations in Oregon, Washington, Idaho, Montana, North Dakota, and South Dakota.
In New York state, Dunkin sales have overtaken Starbucks during the pandemic
Zooming in on New York state, sales at Dunkin and Starbucks were closely matched prior to the pandemic. In August 2019, Dunkin held 51 percent of sales between the two companies, and then Starbucks accounted for just over half of sales between October 2019 and January 2020. When shelter-in-place orders went into effect in spring 2020, Dunkin’s sales did not drop as dramatically as Starbucks’. Nationwide, about half of Starbucks restaurants were closed during this time, compared to about 10 percent of Dunkin locations.
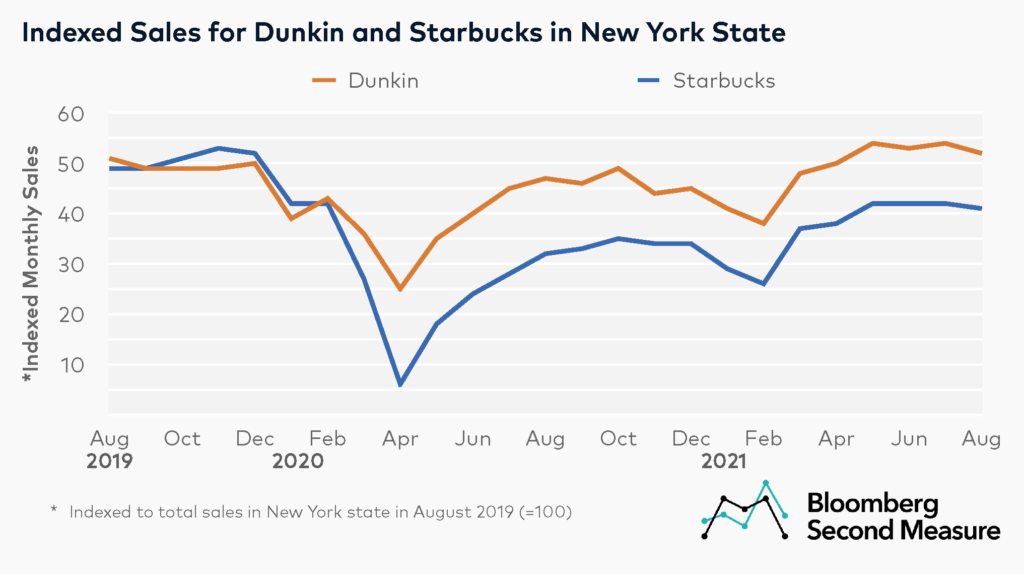
Between March and April of 2020, Dunkin’s sales in New York declined 30 percent, compared to 76 percent for Starbucks. This resulted in a significant shift in the share of sales, with Dunkin accounting for 80 percent of sales between the two companies in April 2020.
While both companies have been gradually recovering and opening their dine-in facilities, only Dunkin’s sales have reached pre-pandemic levels. Starbucks sales in New York state are still 17 percent lower than they were in August 2019. The share of sales gap between the two companies has been slowly closing since April 2020.
The pandemic has affected consumer preferences and ingredient supply at beverage companies
Beverage companies, including coffee shops and bubble tea chains, have struggled with supply chain shortages over the past several months. Some Starbucks locations have reportedly been stockpiling pumpkin sauce and other key ingredients in preparation for PSL season. At the same time, many consumers have turned to making coffee at home during the pandemic, corresponding with a spike in coffee subscription sales.
*Note: Bloomberg Second Measure regularly refreshes its panel and methods in order to provide the highest quality data that is broadly representative of U.S. consumers. As a result, we may restate historical data, including our blog content.