NOTE: Bloomberg Second Measure launched a new and exclusive transaction dataset in July 2022. Our data continues to be broadly representative of U.S. consumers. As a result of this panel change, however, we recommend using only the latest posts in assessing metrics, and do not support referring to historical blog posts to infer period-over-period comparisons.
There’s no denying it’s been a rough year for Uber. It received months of bad press over scandals that included alleged sexual harassment and intellectual-property theft, as well as the surge-pricing incident that spawned January’s #DeleteUber campaign. The company’s founder and CEO, Travis Kalanick, ultimately resigned in June, and media outlets have cited Second Measure data many (many, many, many) times showing Lyft continues to encroach on Uber’s dominant share of the ride-hailing market. But market share doesn’t tell the whole story.
The outlook for Uber isn’t as dim as you may think—mostly because, lately, customers don’t seem to care that much about Uber’s terrible headlines.
It’s definitely true that Lyft has gained on Uber in terms of U.S. market share, particularly during January’s #DeleteUber frenzy when Uber lost 200,000 customers in a single weekend. In September, Uber claimed 73 percent of U.S. ride-hailing sales, down from 83 percent a year prior.
![[Uberlyft-chart1b]](https://secondmeasure.com/wp-content/uploads/2017/11/Uberlyft-chart1b.png)
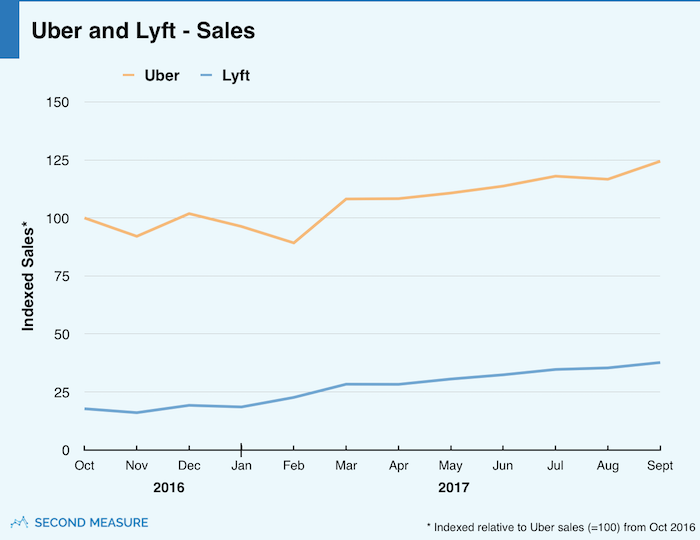
Nevertheless, Uber sales persisted
It didn’t take long for Uber to fully recover from the #DeleteUber campaign. Although U.S. sales took a nosedive in January and February, they were right back up to previous levels by March. Now, both Uber and Lyft sales are increasing steadily.
Between March and September, Lyft’s sales grew by an impressive 33 percent. Uber saw less growth in that time period—just 15 percent—but its overall sales are still 3.3x Lyft’s.
Uber has the edge on frequent riders
Uber’s U.S. customers are using Uber more often than Lyft’s U.S. customers are using Lyft. In the last 12 months, riders took Uber an average of 5.2 times per month. It was 4.5 times per month for Lyft.
Most riders don’t use both
It’s also clear most riders are loyal to their favorite brand—or simply creatures of habit. In September 2017, only 10 percent of rideshare customers used both services, and that number has been pretty consistent throughout the year. Nineteen percent of customers exclusively took Lyft, and the remaining 71 percent were all-in for Uber.
While the percentage of riders using both services has remained constant, the mix of Uber and Lyft loyalists has changed this year. In December—just before the #DeleteUber campaign—about 13 percent of riders solely used Lyft. By March, it was nearly 17 percent, and now it’s up to 19 percent.
But it’s still either company’s game
Perhaps the most revealing point is this: The vast majority of Americans don’t use either service—at least not yet. In September, about 10 percent of all U.S. consumers took Uber, and 4 percent took Lyft.
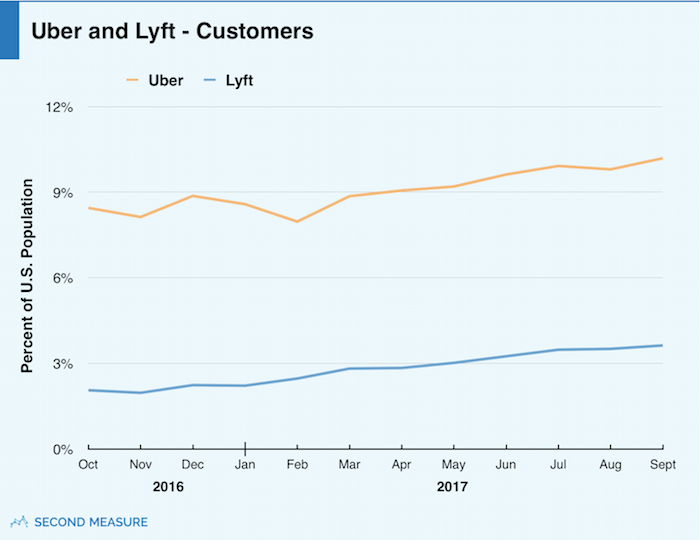
There’s plenty of room for both companies to grow by attracting the many customers who have never used either service. In the race for riders, we’re still far from waving the checkered flag.
Want to keep up with all the ways Lyft is (or isn’t) gaining on Uber? Request a demo today>>