NOTE: Bloomberg Second Measure launched a new and exclusive transaction dataset in July 2022. Our data continues to be broadly representative of U.S. consumers. As a result of this panel change, however, we recommend using only the latest posts in assessing metrics, and do not support referring to historical blog posts to infer period-over-period comparisons.
Options for money transfers have expanded in recent years, as peer-to-peer platforms and cryptocurrency have grown in popularity as alternatives to traditional banks. Consumer transaction data reveals that Wise, formerly known as TransferWise, has accounted for a growing share of the money exchanged by U.S. consumers using international money transfer services, overtaking more established competitors like Xoom and Western Union. Furthermore, the data indicates that Wise’s market share growth is likely due to not only a growing customer base, but also its higher average transaction values versus those of competitors.
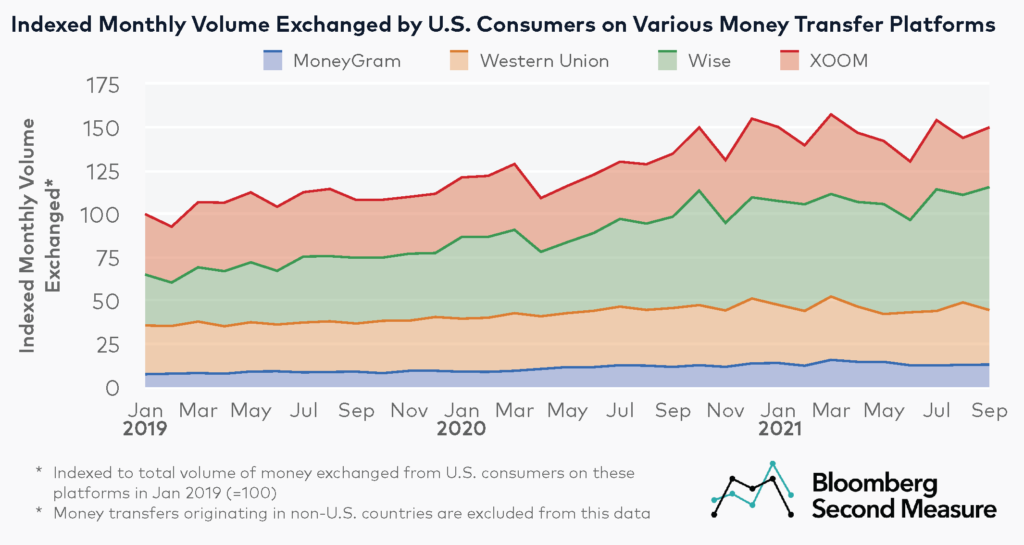
Wise accounts for almost half of the money exchanged by U.S. consumers among a selection of money transfer platforms
The amount of money exchanged by U.S. consumers on international money transfer services has increased during the pandemic. In September 2021, the combined volume of money transferred by U.S. consumers using the international money transfer companies in our analysis (Western Union, MoneyGram, Xoom, and Wise) was 39 percent higher than in September 2019. Notably, Bloomberg Second Measure data only captures U.S. transactions. Money transfers originating in non-U.S. countries are excluded from this data.

Wise—which recently went public via a direct listing in the U.K.—is the newest company in the analysis and has gained an increasing share of money exchanged by U.S. consumers over the past few years. In January 2019, Wise’s share of money exchanged from the U.S. was 29 percent among the four companies. But in September 2021, that share increased to 47 percent. Xoom, an international money transfer service owned by PayPal, came in second with a 23 percent share, while Western Union was third with 21 percent in September 2021.
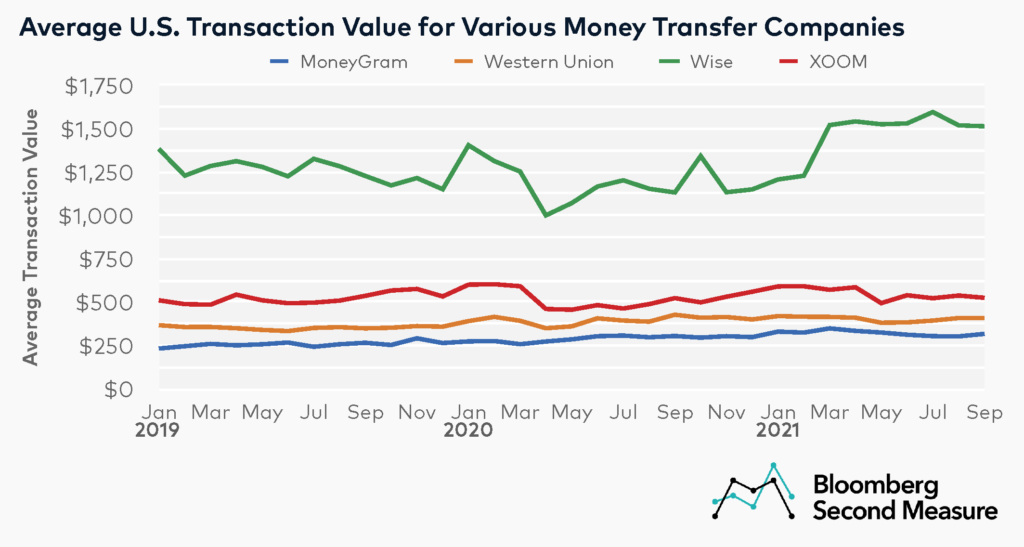
Wise has the highest U.S. average transaction value
A likely factor in Wise’s growing share of transaction volume from U.S. consumers on international money transfer platforms is its average transaction value. Wise has the highest U.S. average transaction value among the competitive set. In September 2021, the U.S. average transaction value at Wise was $1,514, about three times higher than its nearest competitor, Xoom.

Wise experienced especially strong growth in average transaction value in March 2021, with a 24 percent increase month-over-month and a 21 percent increase year-over-year. The average transaction value remained elevated for Wise throughout the summer and early fall. In September 2021, the U.S. average transaction value at Wise was 34 percent higher than the year before. By contrast, MoneyGram had the lowest U.S. average transaction value, with $318 in September 2021.
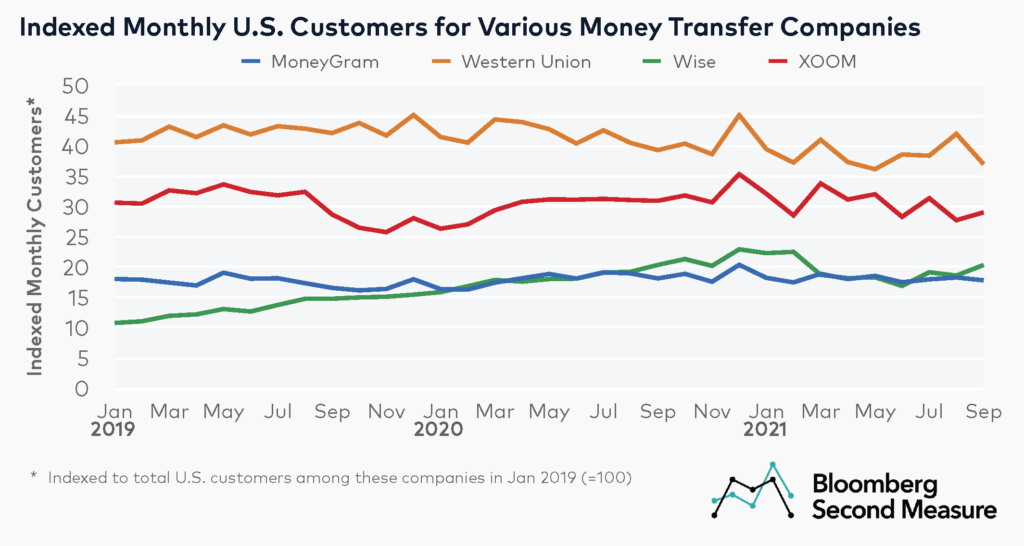
Western Union has the most U.S. customers among international money transfer services
Despite capturing almost half of the money exchanged by U.S. consumers among this competitive set, Wise only accounted for 20 percent of U.S. customers in September 2021. Western Union had the highest volume of U.S. customers, accounting for 36 percent among these companies in September 2021.

Wise experienced the most U.S. customer growth over the past few years. The volume of U.S. customers at Wise nearly doubled between January 2019 and January 2021. Wise’s U.S. customer counts in September 2021 were also 38 percent higher than its U.S. customer counts from two years ago, compared to the industry average increase of 2 percent during the same period.
Wise’s U.S. customer counts have recently surpassed those of MoneyGram, which had the lowest U.S. customer volume in September 2021, with 17 percent of U.S. customers among the competitive set.
*Note: Bloomberg Second Measure regularly refreshes its panel and methods in order to provide the highest quality data that is broadly representative of U.S. consumers. As a result, we may restate historical data, including our blog content.
