NOTE: Bloomberg Second Measure launched a new and exclusive transaction dataset in July 2022. Our data continues to be broadly representative of U.S. consumers. As a result of this panel change, however, we recommend using only the latest posts in assessing metrics, and do not support referring to historical blog posts to infer period-over-period comparisons.
Kathryn Gessner and Kathryn Roethel Rieck contributed to this report.
Historically, whales have gotten a bad rap. In Greek mythology, whales were depicted as ferocious sea monsters, and we all know how Moby Dick ends. However, for many consumer businesses, the “whales” are a prized catch. The term refers to the big spenders, high-rollers, and frequent flyers responsible for an outsized share of a company’s sales.
In 2016, just 20 percent of customers were responsible for more than half the money raked in by 854 of the 1,000 largest companies that Second Measure tracks (by total U.S. customers). Consumer spending data shows, at these businesses, the average customer in the top 20 percent spent 8x as much as the average customer from the bottom 80 percent. (We call this multiplier WI80 — the Whale Index for the 80th percentile.)
The split between whales and small fish was even more extreme at 293 of the companies. Here, the top 10 percent of customers generated more than half of all sales dollars and spent, on average, 15x as much as the bottom 90 percent.
Why whales matter
Companies that earn a large percentage of sales from a small percentage of customers are staking a lot on their ability to keep those customers coming back—or on their chances of capturing new whales. Companies with a more even distribution of sales might not be hit as hard by the loss of a few top customers, but they’re also less likely to get a big boost in sales from a small number of loyal spenders.
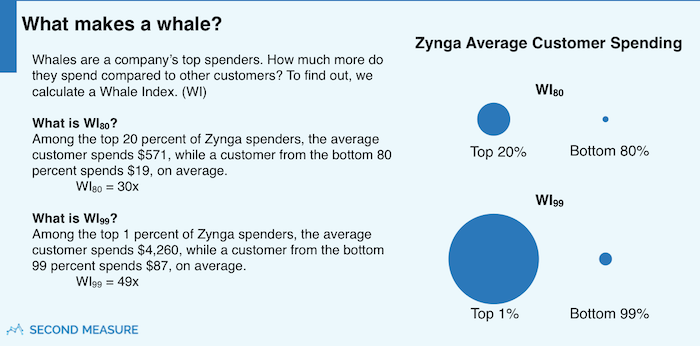
One tale of a whale: Zynga
Some companies really (and we mean really) depend on their biggest spenders. For example, at social gaming company Zynga (best known for hit casual games like Farmville and Words With Friends), the top 20 percent of spenders accounted for a whopping 88 percent of sales in 2016. And just one percent of paying Zynga customers registered 33 percent of sales.
Zynga’s business model is built for whales. The company allows gamers to play for free but entices them to spend money to progress more quickly. Many players never spend anything, so they’re not included in our analysis. The majority of those who do pay don’t pay much—an average of just $19 per year for the bottom 80 percent of paying customers. But Zynga’s big spenders really live up to their reputations. Customers in the top 20 percent spent an average of $571 in 2016, and customers in the top 1 percent spent more than $4,000 each! (This means, at Zynga, WI80=30x and WI99=49x.)
Zynga is an extreme example, but even companies with traditional business models rely on whales. At giant retailers like Walmart, Target, and Amazon, the top 20 percent of spenders accounted for 65-70 percent of credit and debit card sales dollars in 2016. At all three, WI80=8-9x.
Which industries include the biggest whales?
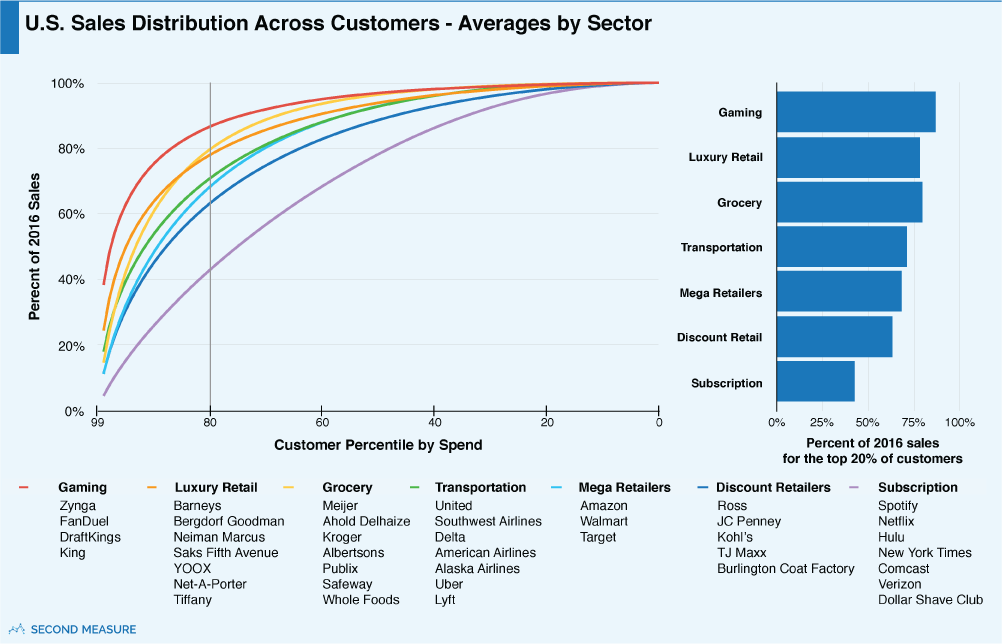
The chart above plots the proportion of sales generated by each percentile of customers. (The 99th percentile is the top 1 percent of spenders.) A diagonal line would mean all customers in the industry spent the same amount. A sharply bending curve indicates an industry where a small number of whales drive most of the spending.
Alongside Zynga, companies in the gaming sectors tend to be highly whale-dependent. Zynga-competitor King (maker of Candy Crush) and daily fantasy sports sites FanDuel and DraftKings were among the companies with the most concentrated spending.
Sales at luxury goods retailers also tend to be condensed amongst a small percentage of customers. For example, at Tiffany & Co. (WI80=14x), it’s possible to spend hundreds of thousands of dollars in an act of romantic devotion. The top 20 percent of spenders dropped an average of $4,300 each last year. (Compare that to the average of $300 spent by the hoi polloi.)
At the other extreme, companies with subscription models, such as Netflix, Hulu, and Spotify, had a much more equitable distribution of spending across their customer bases, with WI80 around 2x. Likewise, at eyewear retailer Warby Parker (whose products have relatively low price variance), WI80 was only 3x.
Of whales and unicorns
Now that we’ve seen how individual companies, and even whole industries, can be differentiated based on the whale index, we can use this metric as a new way to benchmark startups (and recent IPOs) like Airbnb, Uber, and Blue Apron. All operate relatively new business models that fall outside the bounds of traditional industry categories.
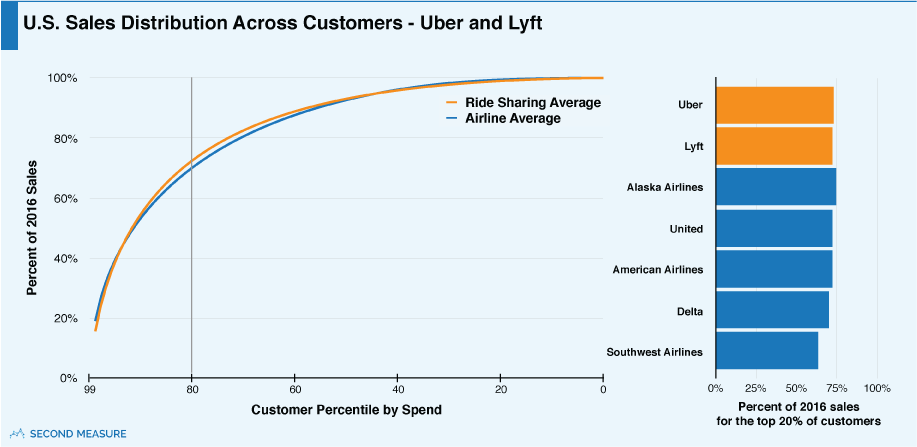
Top ride-hailing customers behave like frequent flyers
Interestingly, ride-sharing apps Uber and Lyft, both with WI80 of approximately 11x, have spending distributions that are strikingly similar to those of major airlines like Delta, United, and American Airlines. Like major airlines, Uber and Lyft derive an outsized proportion of sales from a small number of frequent riders.
The top 20 percent of Uber customers rode with Uber 73 times on average in 2016, and all those trips cost them an average of $1,160 per person. The bottom 80 percent of riders only averaged seven trips and spent $108 with Uber.
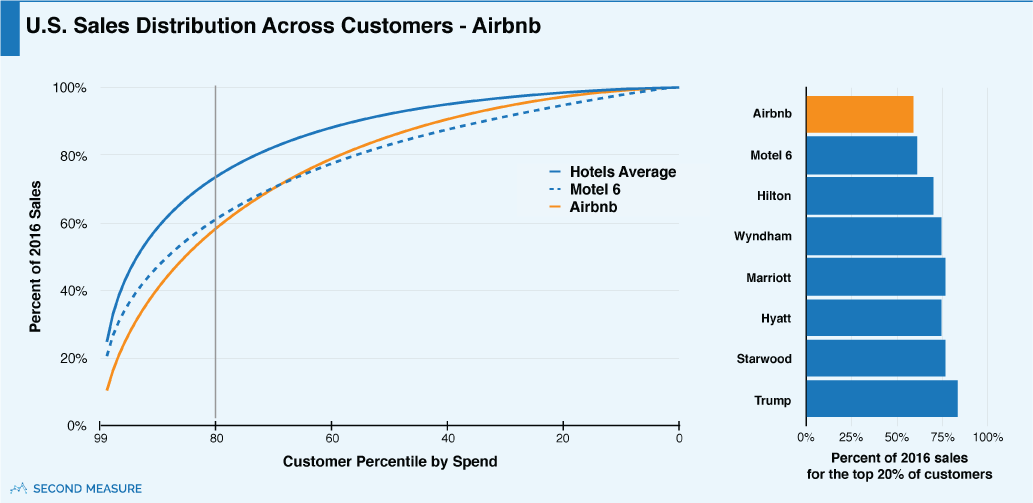
More whales at upscale hotels than at Airbnb
While the hotel industry looks warily upon Airbnb’s growth, Airbnb’s WI80 of 6x more closely resembles that of budget hotelier Motel 6 than of upmarket hotel chains like Hilton (WI80=9x) and Marriott (WI80=13x).
This is because the more-upscale hotels also earn money from many small transactions: parking fees, bar and restaurant tabs, and the like. Of course, not all of the parkers and diners are staying at the hotel, and the ones who are—especially for long periods of time—are the whales. Lodging accounts for most of the sales at budget hotels and Airbnb—no extra frills—so there’s less variance in what customers spend here. Simply put, would-be whales have fewer opportunities to spend above and beyond the norm.
Blue Apron and Stitch Fix don’t match trends in their industries
It might seem natural to lump e-commerce retailer Stitch Fix into the fashion sector, but its customer-spending distribution (WI80=5x) more closely resembles that of a subscription service like Netflix or Spotify. Fashion retailers like J.Crew (WI80=8x) and Macy’s (WI80=9x) rely more heavily on whales.
One reason for this: it’s a lot easier to drop big bucks at a place that doesn’t limit how many items you can buy at a time. At most retailers, you can buy as many items as you want, any time you want. But at Stitch Fix, you max out at five items because that’s all each shipment contains. And, indeed, the average J.Crew or Macy’s shopper spent about $100 per outing in 2016, where the average Stitch Fix receipt was closer to $75.
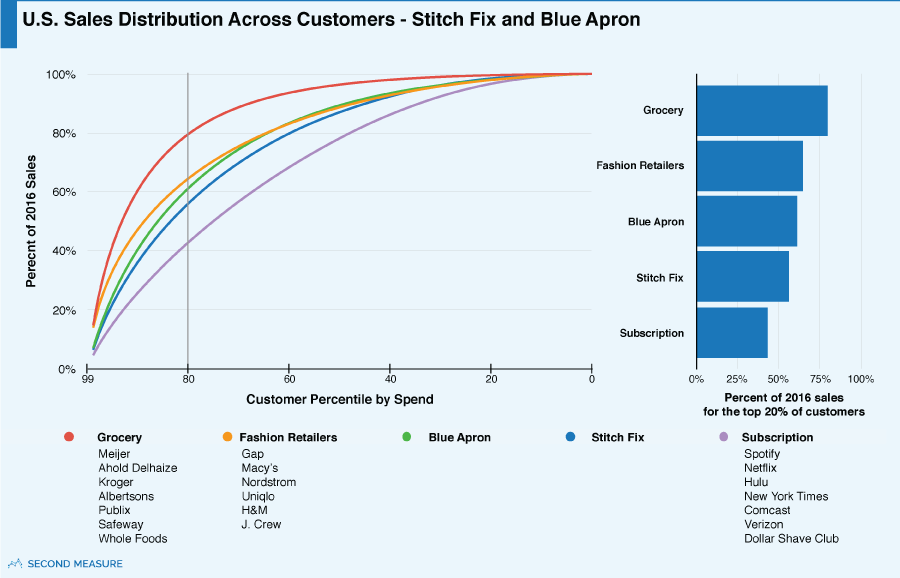
Meal-kit service Blue Apron’s customer distribution (WI80=6x) also looks a lot more like a subscription service than traditional grocery stores such as Safeway (WI80=16x) or Whole Foods (WI80=18x). This is hardly surprising because, as in the fashion example, customers in supermarkets have a huge selection of products to choose from and can shop as often as they like. Blue Apron strictly offers ingredients for a specified number of dinners, and subscribers pay for a whole week’s order at once.
Yet, Blue Apron’s distribution looks less like a subscription service than Stitch Fix’s. The reason: some Blue Apron customers use the service infrequently while others—the whales—use it for multiple family meals over many weeks. The top 20 percent of customers ordered an average of 25 times in 2016 and spent an average of $1,750. That’s a stark contrast to the bottom 80 percent, who only ordered an average of four times and spent $275.
There was much less variance in the number of Stitch Fix orders customers made, so Stitch Fix’s spending distribution looks more like that of a subscription than Blue Apron’s does. The worry for Blue Apron, of course, is that if its whales churn to another meal-kit service, the company could be left floundering.
Interested in whale-watching from the comfort of your desk? Request a demo today.