NOTE: Bloomberg Second Measure launched a new and exclusive transaction dataset in July 2022. Our data continues to be broadly representative of U.S. consumers. As a result of this panel change, however, we recommend using only the latest posts in assessing metrics, and do not support referring to historical blog posts to infer period-over-period comparisons.
The coronavirus continues to impact Americans’ daily lives as many face the stark reality of shelter-in-place orders and a volatile financial market. By analyzing consumer spending, Second Measure transaction data can surface U.S. spending trends in near-real time to provide insights in these unprecedented times. Recent data reveals, as of the week of March 23 – 29, overall U.S. consumer spending is down 7 percent, relative to the comparable week last year.
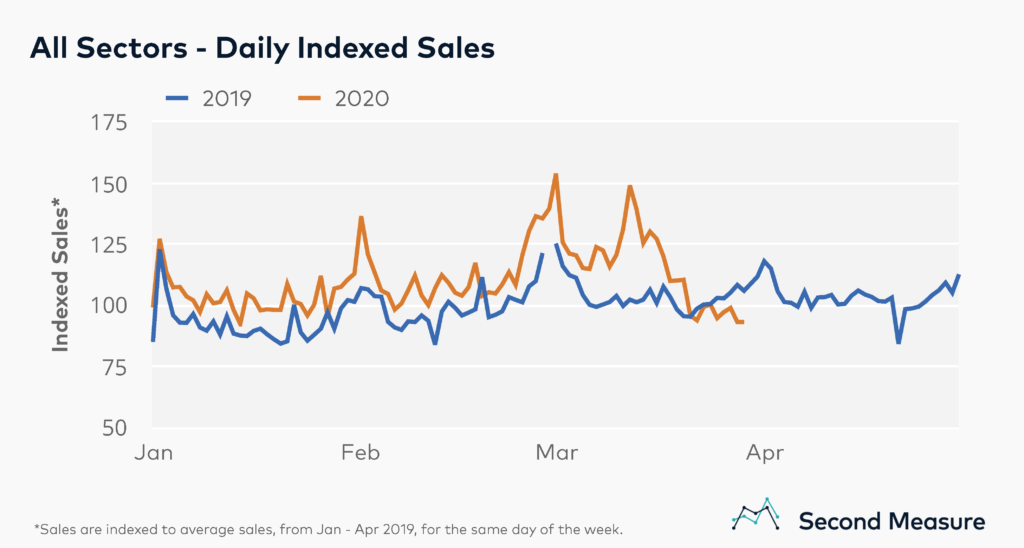
Our analysis of all sectors aggregates data from over 4,500 major U.S. companies and brands. This analysis does not include sales at local brick-and-mortar businesses, B2B spending, or cash transactions, all of which may be impacted to a greater degree.
Within many industries, Americans are also spending differently than in 2019—cancelling spring break vacations and stocking up on essentials at wholesale clubs. Industry-level data helps reveal which sectors are most impacted by the coronavirus. (Note that with 2020 being a leap year, our analysis includes data from February 29, 2020 and a null data point for 2019.)
Transportation spending plummets as Americans stay home
As an increasing number of U.S. cities and states have issued shelter-in-place orders to limit the spread of the coronavirus, Americans are adapting to reduced mobility and, as a consequence, the transportation industry is suffering. Our analysis aggregates data from 66 companies representing both commercial and chartered air travel, cruise lines, and bus companies, as well as rideshare and micro-mobility. Data from the week of March 23 – 29 shows the industry’s sales have dropped 88 percent year-over-year.
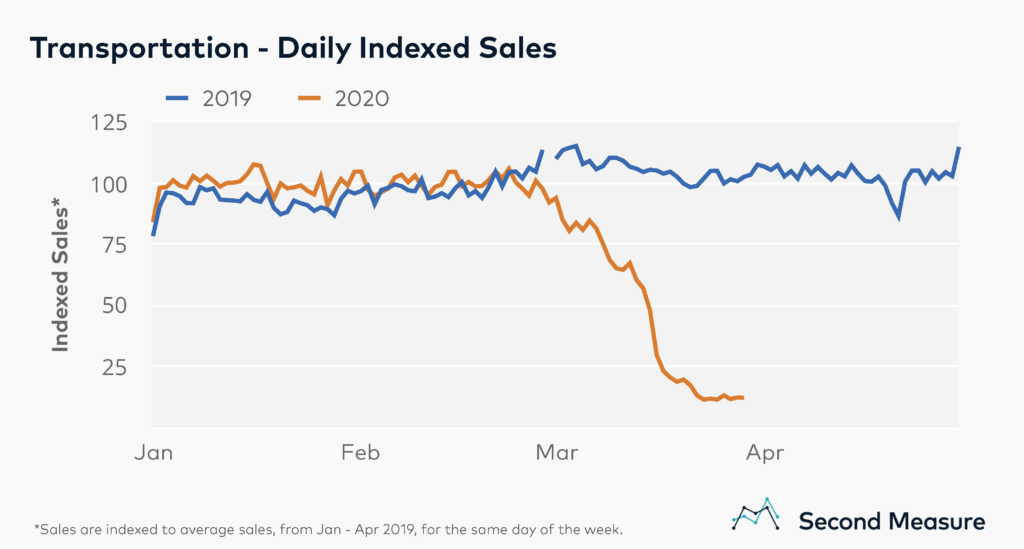
Nationwide, transactions at rideshare companies have plummeted. Uber and Lyft combined weekly sales were down 84 percent year-over-year. Meanwhile, average transaction values are on the rise, reaching peak levels compared to earlier weeks in 2020. Average U.S. fares are up to roughly $18 for both Uber and Lyft, which might indicate a reduction in short-distance trips or an imbalance between the supply of drivers and demand from riders.
Quarantined consumers increasingly look to delivery
With restricted mobility comes an increased dependency on having everyday products appear on our doorsteps. Quarantined Americans are relying on delivery companies—both traditional couriers and gig-economy services—to move everything from apparel and office supplies to groceries and takeout. An analysis of U.S. consumer spending at 72 delivery companies reveals that the industry’s year-over-year sales have increased 78 percent as of March 29.
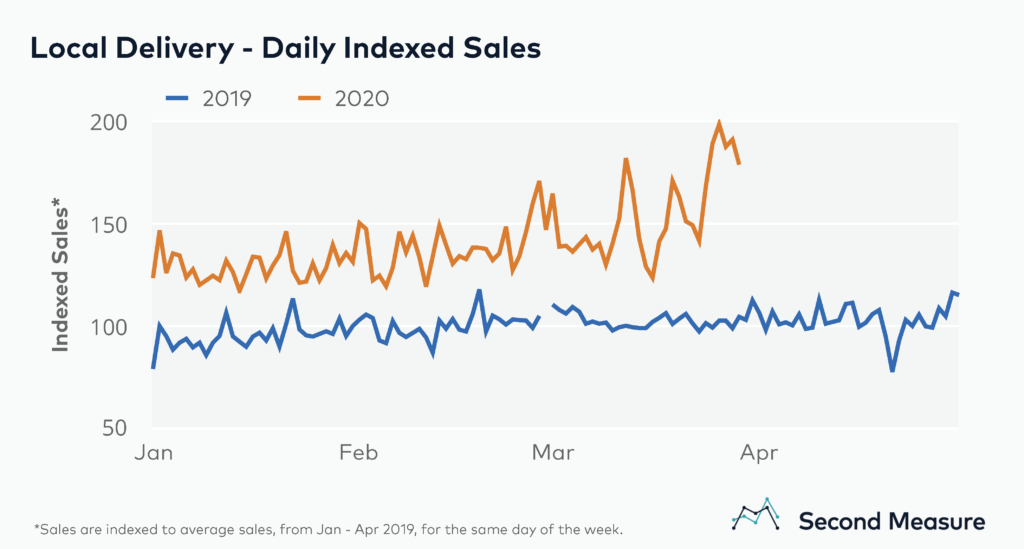
Extreme demand for grocery delivery in particular has left some Americans queuing online for delivery appointments several days in advance. As a result, Instacart—which partners with grocery stores in all 50 states—has seen record high sales. Throughout March, average weekly sales were up 82 percent relative to weekly averages from January and February of this year.
To see data on a 5-day lag from these industries and many more, request a demo today.