NOTE: Bloomberg Second Measure launched a new and exclusive transaction dataset in July 2022. Our data continues to be broadly representative of U.S. consumers. As a result of this panel change, however, we recommend using only the latest posts in assessing metrics, and do not support referring to historical blog posts to infer period-over-period comparisons.
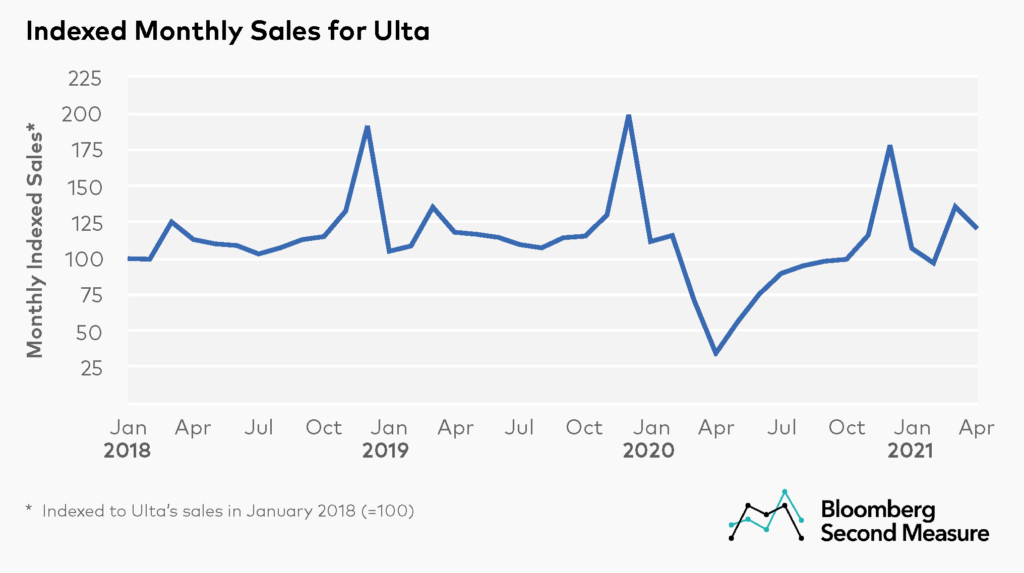
Increasing vaccination rates and loosening policies in regards to large gatherings and mask-wearing have re-ignited consumers’ interest in beauty products. One of the main beneficiaries of this phenomenon is Ulta Beauty, whose Q1 2021 earnings outperformed investors’ expectations. Consumer transaction data reveals that Ulta’s 2021 sales are surpassing historical performance, with sales in March and April 2021 exceeding same-month sales from the previous three years.
Historically, Ulta sees its highest annual sales during the holiday season in November and December, followed by a modest increase in sales in March. However, Ulta was severely impacted in the early months of the pandemic. Sales declined 47 percent year-over-year in March 2020 and 71 percent year-over-year in April 2020. Ulta’s sales slowly began to recover over summer 2020, but monthly year-over-year sales growth still averaged -16 percent between June and December 2020.

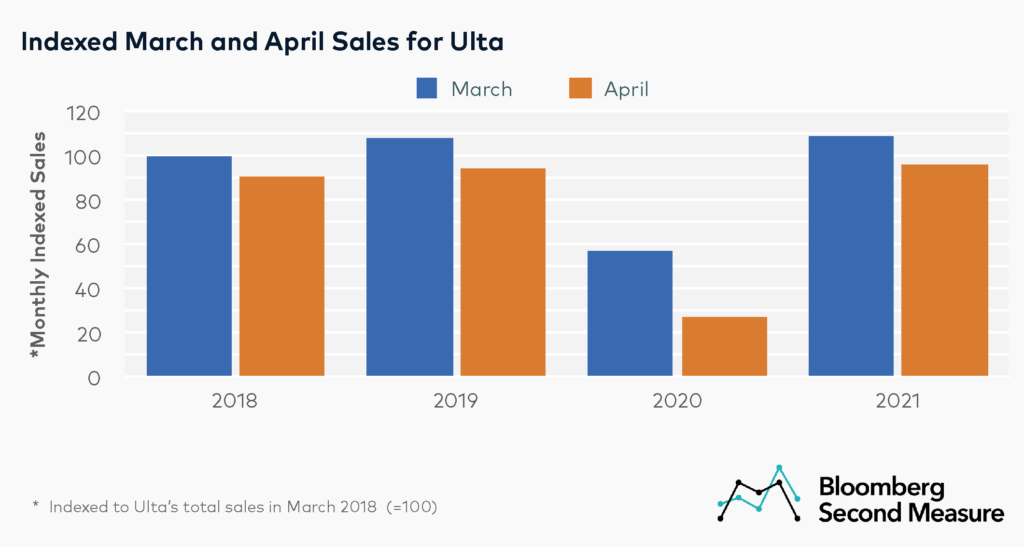
Ulta’s recovery accelerated in early 2021; sales in March 2021 were nearly double that of March 2020. Even without the anomaly of 2020, Ulta’s March sales matched or exceeded same-month sales in prior years. In fact, March 2021 sales were about the same as sales in March 2019 and 8 percent higher than sales in March 2018. Likewise, Ulta’s sales in April 2021 exceeded same-month sales in 2018, 2019, and 2020 by 7 percent, 2 percent, and 249 percent, respectively.

Ulta customers are gradually returning to brick-and-mortar channel
Ulta sells beauty products through its network of brick-and-mortar locations, as well as its e-commerce site. Early in the pandemic, some online beauty retailers and beauty subscription boxes saw rising sales as makeup and beauty stores closed. Ulta also experienced a shift toward online sales in that period. However, the company’s sales by channel in recent months reveals that customers are returning to in-person shopping.

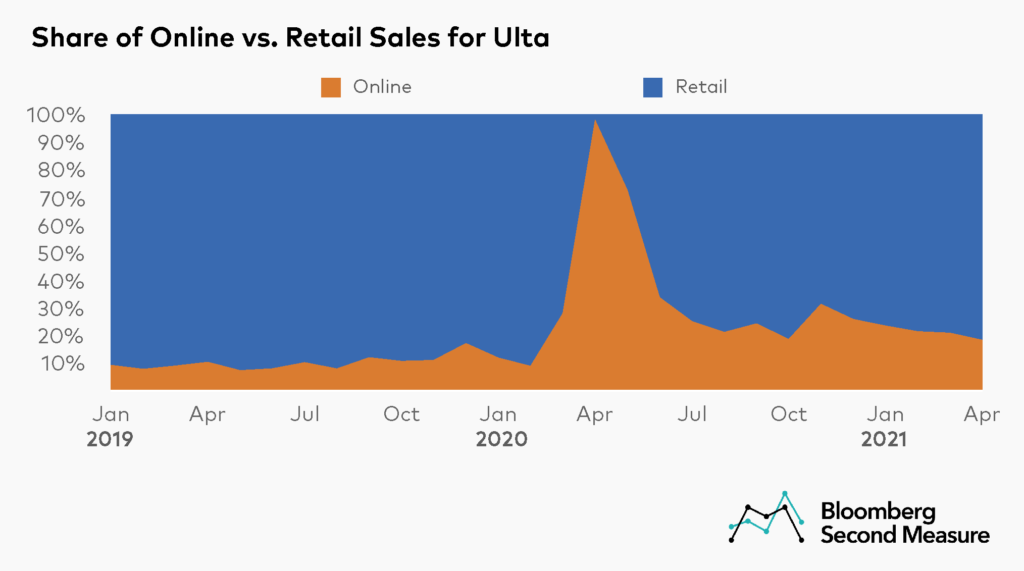
In 2019, only 10 percent of Ulta’s sales per month, on average, took place online. By 2020, one-third of Ulta’s average monthly sales were from online channels. Zooming in on the effect of the pandemic specifically, this channel breakdown is elevated because almost all of Ulta’s sales in April 2020 were online while nonessential businesses were closed.
Ulta’s share of online sales has been mostly decreasing since June 2020, with the exception of a holiday spike. In November, 31 percent of sales were online compared to only 18 percent in April 2021. While the share of online sales is currently still higher than pre-pandemic levels, the gradual decrease may indicate that consumers are growing more comfortable with retail shopping again. Some Ulta stores have also resumed salon services, which is also likely to affect the share of online vs. retail sales.
Transaction data revealed Ulta’s strong sales before earnings call
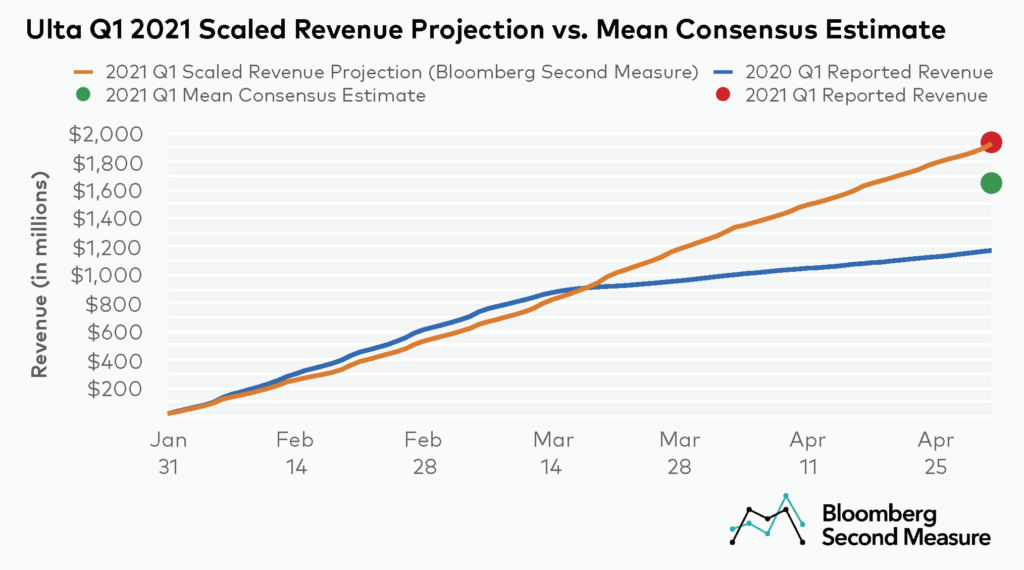
On May 27, Ulta announced that its first quarter earnings were its highest on record, reaching $1.94 billion. This came as a surprise to investors, as the mean consensus underestimated Ulta’s projected earnings by 15 percent. However, Bloomberg Second Measure’s scaled revenue projections from May 1 forecasted Ulta revenue of $1.99 billion, coming within less than 1 percent of reported revenue.

*Note: Bloomberg Second Measure regularly refreshes its panel and methods in order to provide the highest quality data that is broadly representative of U.S. consumers. As a result, we may restate historical data, including our blog content.
