Chinese ecommerce giant Shein has experienced a meteoric rise in the U.S. fast fashion market, with its sales and market share overtaking competitors such as H&M, Fashion Nova, Forever 21, ASOS, and Zara during the COVID-19 pandemic. Using U.S. consumer spending data, we analyzed how Shein’s U.S. sales have boomed over the past few years, as well as how other fast fashion companies have fared.
Shein has accounted for a growing percentage of fast fashion market share in the U.S.
Shein’s growth skyrocketed in early 2020, with the company’s U.S. sales roughly doubling between March and April of that year. ASOS and Fashion Nova—both digitally native fast fashion companies—also experienced some sales growth during this time, with respective increases of 13 percent and 7 percent. By contrast, sales at the omnichannel merchants—H&M, Zara, and Forever 21—declined as shelter-in-place orders went into effect. It is worth noting that Bloomberg Second Measure’s U.S. consumer spending data only observes sales through each company’s own website or stores. International spending, as well as purchases through gift cards, financing, or third-party retailers (such as Forever 21 sales made through J.C. Penney) are excluded from our data.
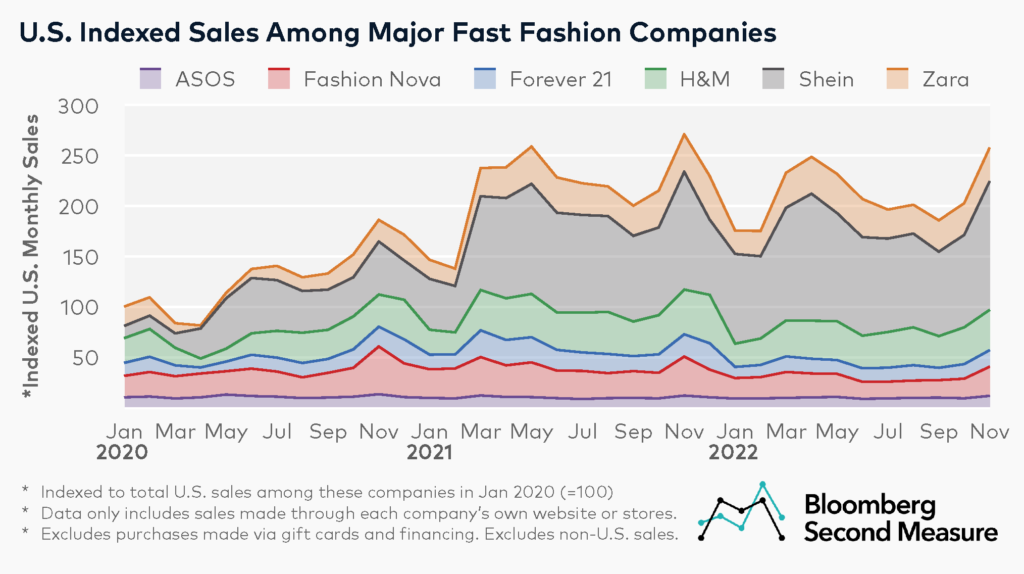
On a year-over-year basis, Shein was the only fast fashion company in our analysis that experienced U.S. sales growth in November 2022, with an increase of 9 percent. Sales at ASOS declined 2 percent year-over-year, while both H&M and Zara declined 10 percent. Fashion Nova and Forever 21 also experienced negative U.S. sales growth year-over-year, with respective decreases of 25 percent and 26 percent. Notably, these companies all held sales in late November around Black Friday and Cyber Monday.
In addition, Shein has captured an increasing percentage of U.S. fast fashion market share over the past three years. In January 2020, shortly before the onset of the COVID-19 pandemic, Shein earned 12 percent of U.S. fast fashion sales. In November 2022, Shein accounted for 50 percent of sales among these fast fashion competitors. That same month, the U.S. share of sales was 16 percent for H&M, 13 percent for Zara, 11 percent for Fashion Nova, and 6 percent for Forever 21. ASOS had the lowest share of U.S. fast fashion sales, with 4 percent.
Shein’s primary audience is Gen Z consumers, and it has focused much of its marketing efforts on social media influencers on platforms such as Instagram and TikTok. In April 2022, Shein closed a funding round that valued the company at $100 billion.
Most sales at H&M, Zara, and Forever 21 still come from the retail channel
While Shein and ASOS operate entirely online and Fashion Nova has a very limited retail presence, the other fast fashion competitors in our analysis see a mix of online and retail sales. For H&M, Zara, and Forever 21, most sales took place online at the height of pandemic lockdowns, but then returned to retail by that summer.
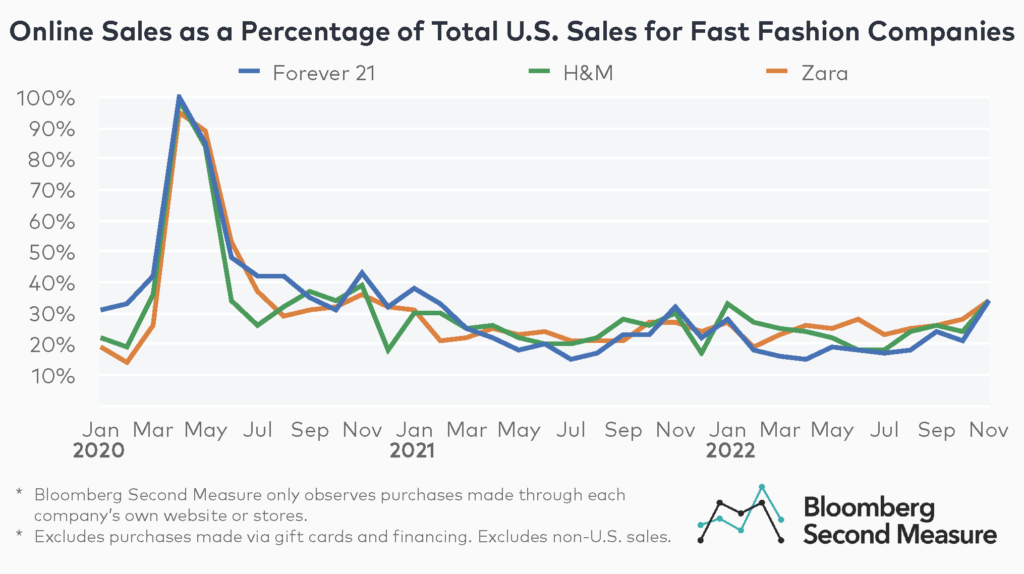
For the first 11 months of 2022, the average monthly percentage of online sales was 26 percent at Zara, 25 percent at H&M, and 21 percent at Forever 21. The fast fashion companies also saw an uptick in their share of online sales each November, likely in part because of Cyber Monday. In November 2022, 34 percent of sales at each of these companies took place online. Forever 21, which filed for bankruptcy in late 2019 and shuttered nearly 200 underperforming stores, has also reportedly started relaunching new, smaller stores with more curated merchandise to reflect local shoppers’ demand.
Bloomberg Second Measure launched a new and exclusive transaction dataset in July 2022. Our data continues to be broadly representative of U.S. consumers. As a result of this panel change, however, we recommend using only the latest post in assessing metrics, and do not support referring to historical blog posts to infer period-over-period comparisons.