NOTE: Bloomberg Second Measure launched a new and exclusive transaction dataset in July 2022. Our data continues to be broadly representative of U.S. consumers. As a result of this panel change, however, we recommend using only the latest posts in assessing metrics, and do not support referring to historical blog posts to infer period-over-period comparisons.
Shortly before shelter-in-place orders went into effect in March 2020, many retailers experienced the mad dash of customers stockpiling toilet paper. As supply ran out in brick-and-mortar stores, some consumers turned to DTC companies—such as Who Gives a Crap and Tushy—that offer bathroom products. Who Gives a Crap sells bamboo and recycled toilet paper as well as tissues, while Tushy sells bidets, bamboo toilet paper, and other bathroom accessories. Both of these DTC toilet paper companies saw strong growth in March and April of 2020. New consumer spending data reveals how Tushy and Who Gives A Crap have fared in the year since the initial panic-buying phenomenon.
Sales growth has slowed since the early 2020 spikes
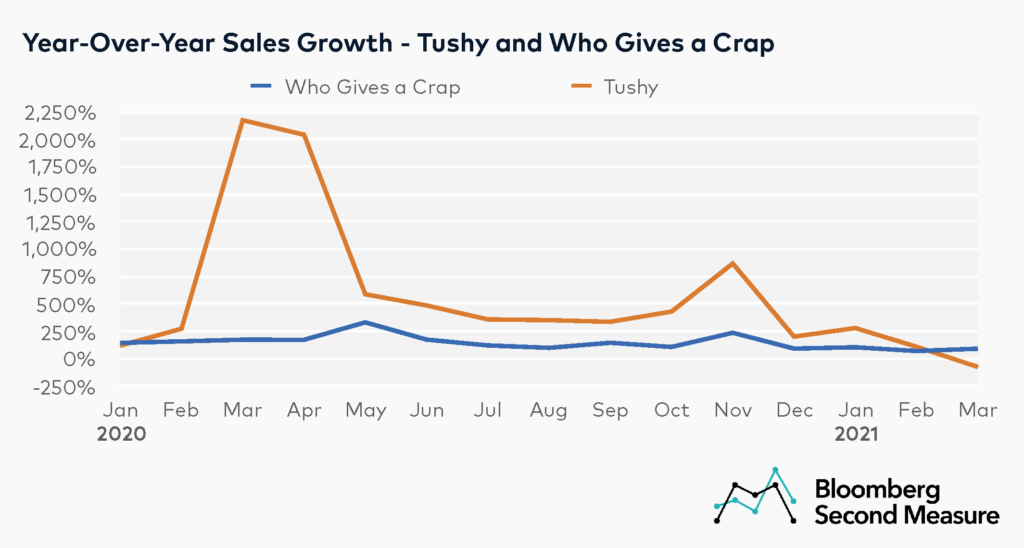
Sales growth for Tushy and Who Gives a Crap has remained high during the pandemic, but has largely decelerated over the past several months. At the height of toilet paper hoarding in March 2020, Tushy experienced 2,173 percent year-over-year sales growth. That same month, Who Gives a Crap had a more modest sales increase of 174 percent year-over-year. While demand for Tushy peaked in March 2020, Who Gives a Crap had its highest pandemic sales growth in May with 332 percent year-over-year, before its sales growth slowed again.

Both Tushy and Who Gives a Crap experienced a second spike in year-over-year sales growth in November 2020, with increases of 868 percent and 237 percent, respectively. Who Gives a Crap has continued to grow since then, with a 92 percent year-over-year increase in sales in March 2021. However, March 2021 is the first month that Tushy experienced a decline in year-over-year sales growth, at -74 percent. This is likely because March 2021 represents the one-year anniversary of the stockpiling frenzy and the company’s biggest-ever month of sales. Another potential reason for Tushy’s decreasing growth rate is because the company primarily sells bidets, which incur a higher upfront cost and much lower recurring revenue.
Bidets maintain the throne as Tushy’s primary line of business
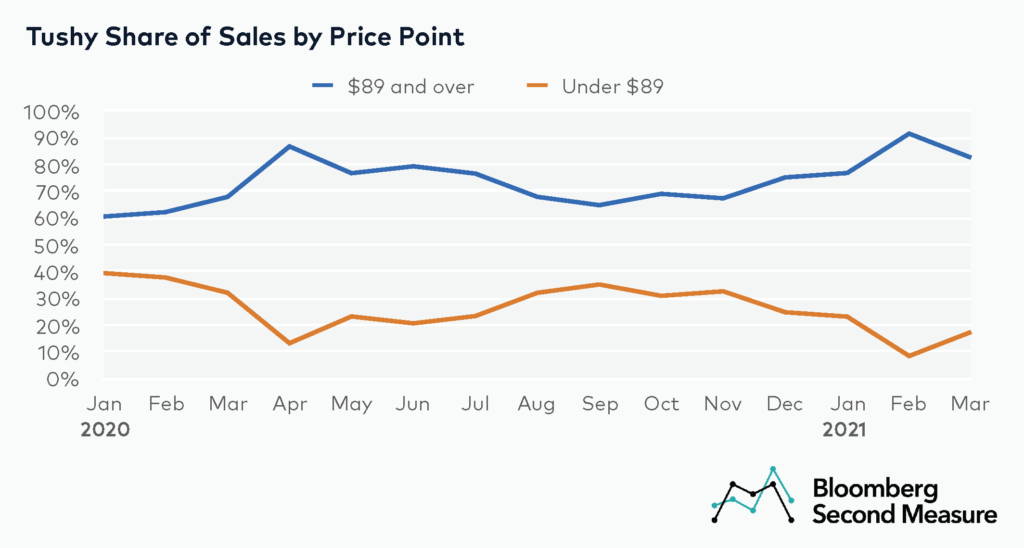
A closer look at assumed bidet sales (i.e., transactions above $89, the cost of Tushy’s entry-level bidet in 2020) found that bidets remained Tushy’s bestsellers in 2020. On average, bidets accounted for 71 percent of Tushy’s monthly sales in 2020.

At the onset of the pandemic in March 2020, transactions above $89 accounted for 68 percent of sales at Tushy. Just one month later, transactions above $89 accounted for 87 percent of sales, suggesting an increase in demand for bidets. The share of transactions under $89 (presumably, toilet paper and other bathroom accessories) increased again in the late summer and early fall, averaging 33 percent of sales between August and November.
The share of sales diverged the most in February 2021, when Tushy’s assumed bidet sales accounted for 92 percent of sales, the highest since the pandemic began. This is likely due to the discovery of many new coronavirus variants popping up across the U.S. and stay-at-home orders going back into effect for some states.
Crap customers still prove to be most valuable
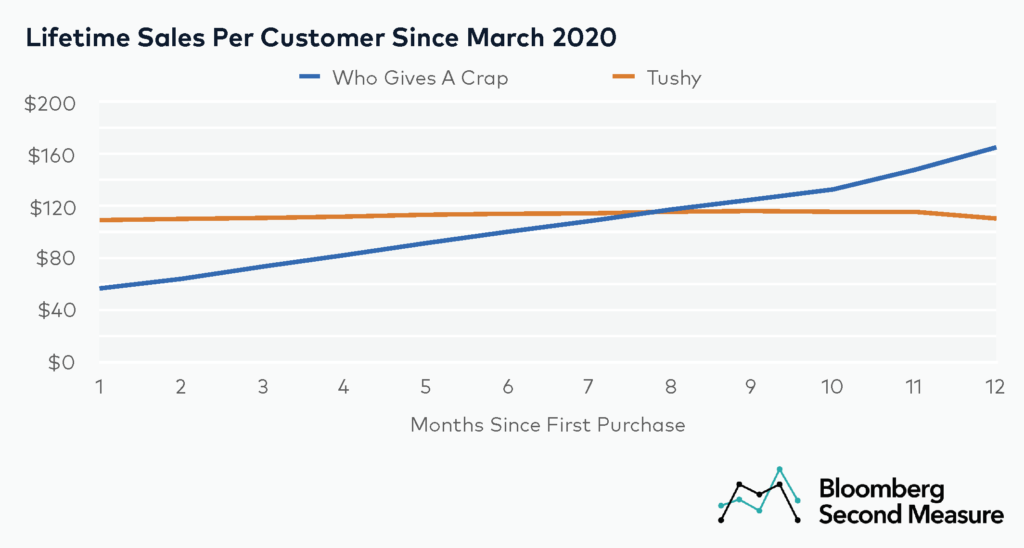
Lifetime sales value for customers who made their initial purchase in March 2020 remained fairly steady for Tushy over the following twelve months, while lifetime sales per customer grew for Who Gives a Crap in the same time period. One month after purchase, Tushy’s lifetime sales per customer was roughly double that of Who Gives a Crap. Around the 8-month mark, lifetime sales per customer at Who Give a Crap pulled ahead of Tushy. Twelve months after initial purchase, Tushy’s lifetime sales per customer was $110, compared to $165 for Who Gives a Crap.

*Note: Bloomberg Second Measure regularly refreshes its panel and methods in order to provide the highest quality data that is broadly representative of U.S. consumers. As a result, we may restate historical data, including our blog content.
