NOTE: Bloomberg Second Measure launched a new and exclusive transaction dataset in July 2022. Our data continues to be broadly representative of U.S. consumers. As a result of this panel change, however, we recommend using only the latest posts in assessing metrics, and do not support referring to historical blog posts to infer period-over-period comparisons.
One of the largest salad chains, Sweetgreen, recently filed for an IPO, which would make it an early player among major salad chains to go public. Sweetgreen’s emphasis on healthy, sustainable food as well as a seamless digital experience has resulted in significant growth over the past several years. With a Sweetgreen IPO on the horizon, consumer transaction data reveals how the company’s sales soared prior to the pandemic and how much of that growth has been driven by the online channel.
Online sales have increasingly contributed to Sweetgreen’s growth
Sweetgreen launched a digital app in 2013, making it one of the first fast casual restaurants to offer mobile app and direct online ordering on its website. A monthly average of 9 percent of sales in 2013 took place online, a share that has grown in subsequent years. Sweetgreen’s overall sales have also increased tenfold since January 2013. Notably, the salad chain’s sales experience some seasonality, with sales in November and December generally remaining lower compared to the rest of the year.
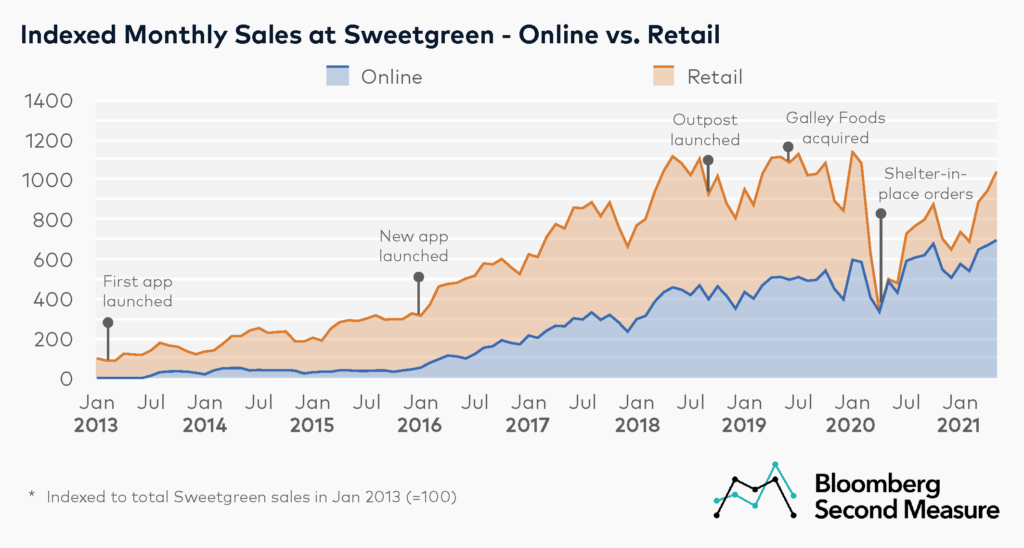
Another major milestone occurred in January 2016, when Sweetgreen relaunched its app with more advanced features. The company experienced particularly strong sales growth that year, with a monthly average growth rate of 79 percent year-over-year. The average monthly percentage of online sales also reached 25 percent in 2016.
Doubling down on delivery as a sales channel, Sweetgreen introduced Outpost service in September 2018, enabling bulk delivery of salad orders to workplaces and residences. Sweetgreen then acquired the meal delivery platform Galley Foods in June 2019, thereby increasing production capacity and courier operations. The online channel accounted for nearly half of monthly sales on average in 2019. In addition to its own app and website, Sweetgreen has also entered partnerships with meal delivery companies. However, meal delivery sales as well as B2B sales are not captured as Sweetgreen transactions in Bloomberg Second Measure’s data.
Sweetgreen’s sales growth was interrupted in March and April 2020, when shelter-in-place orders went into effect during the COVID-19 pandemic. Sales declined 39 percent year-over-year in March 2020 and 70 percent year-over-year in April 2020. In mid-March 2020, Sweetgreen temporarily moved to a digital-only ordering experience, leading to nearly all sales in April and May 2020 originating online. For 2020 overall, a monthly average of 77 percent of Sweetgreen’s sales took place online.
Sweetgreen’s sales gradually began to recover in summer 2020, with the exception of a late 2020 dip in sales coinciding with the seasonal pattern of previous years. Shortly before the Sweetgreen IPO announcement, the company’s sales nearly reached pre-pandemic levels, with May 2021 sales only 7 percent below that of May 2019. More customers are also returning to Sweetgreen’s brick-and-mortar locations; in May 2021, 68 percent of sales were online.
Online customers buy more often and have higher retention rates
Consumer transaction data shows that for Sweetgreen, the number of online transactions per customer is consistently higher than retail transactions per customer. In January 2019, for example, online transactions per customer were 2.3 per month, compared to 1.5 for retail.
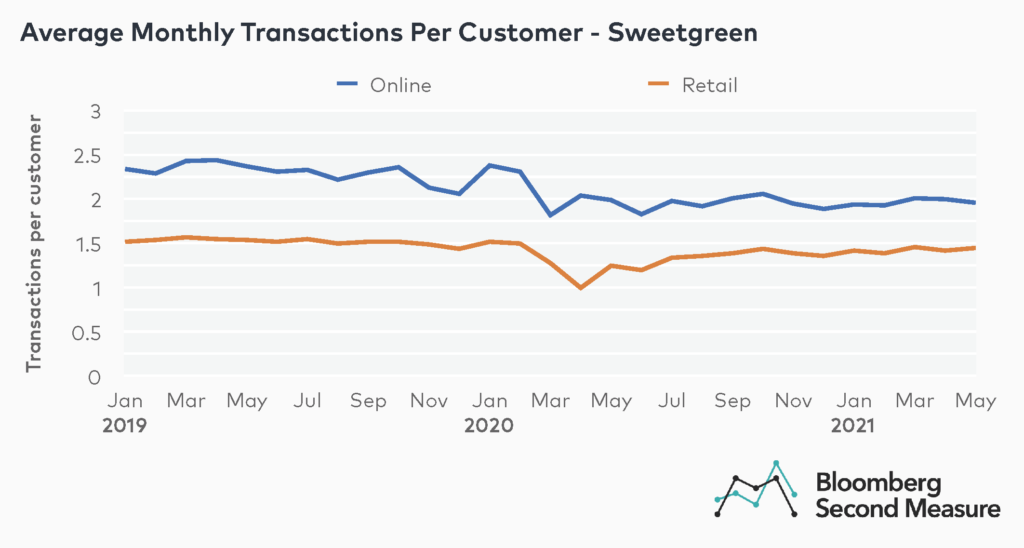
The number of monthly transactions per customer across both channels decreased when the pandemic hit, dipping to 1.0 transaction for retail and 2.0 for online in April 2020. Since then, average transactions per customer for retail has been gradually approaching pre-pandemic levels while average monthly online transactions have held fairly steady. As of May 2021, the average monthly transactions per customer is 2.0 for online and 1.5 for retail.
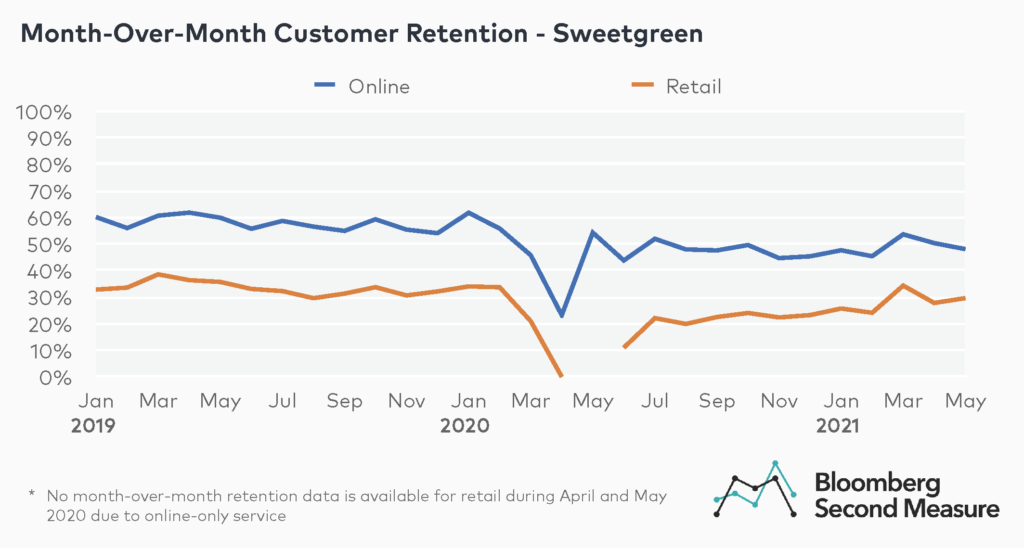
Similarly, month-over-month customer retention is consistently higher for the online channel than the retail channel. In May 2021, month-over-month retention for online customers was 48 percent, compared to 30 percent for retail. Month-over-month retention rates both for online and retail channels have been lower during the pandemic compared to before the pandemic, with a significant dip in spring 2020 that corresponded with shelter-in-place orders and the temporary shift to online-only service.
*Note: Bloomberg Second Measure regularly refreshes its panel and methods in order to provide the highest quality data that is broadly representative of U.S. consumers. As a result, we may restate historical data, including our blog content.