When U.S. cities and states faced shelter-in-place orders to limit the spread of the coronavirus, Americans’ reduced mobility resulted in plummeting sales at rideshare companies. Bloomberg Second Measure’s transaction data analytics show that while observed sales at rideshare industry leaders Lyft (NASDAQ: LYFT) and Uber (NYSE: UBER) began to recover shortly after their early pandemic drop, they did so at different rates.
Uber dominates U.S. market share
Consumer spending data analytics show that in March 2024, observed U.S. rideshare sales at Uber were up 10 percent year-over-year, while Lyft’s observed sales were up 3 percent year-over-year.
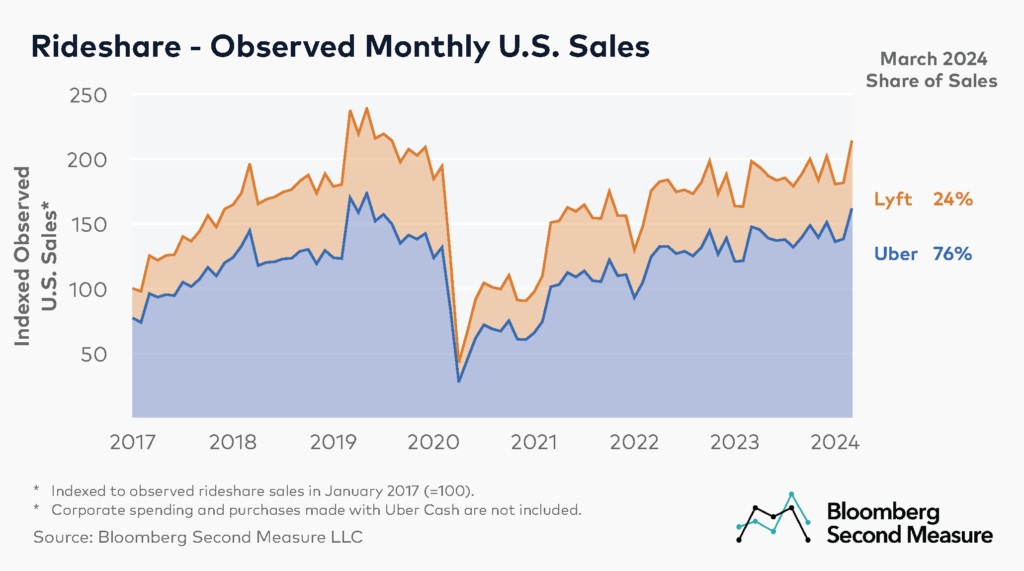
After a dip at the onset of the pandemic, observed U.S. consumer sales at both Lyft and Uber began to recover in May 2020. By April 2022, observed sales at Uber exceeded their pre-pandemic levels and remained elevated throughout most months of 2022 and into 2024. Meanwhile, observed sales at Lyft are yet to reach their pre-pandemic levels as of March 2024.
Notably, during its FY23 Q2 earnings call, Uber reported its first-ever operating profit and highlighted Uber Rides as the business line with the highest year-over-year revenue growth. During its FY23 Q4 call the company announced its first annual operating profit.
Looking at the rideshare competitors’ market share, the breakdown of March 2024 observed sales between Uber and Lyft remained consistent compared to the prior month. In March 2024, Uber accounted for 76 percent of observed U.S. rideshare spending, about the same as in February 2024.
How have observed sales per customer fared at Uber and Lyft following a period of high inflation?
After a period of high inflation in 2021 and 2022, consumers are paying more for their rides. In March 2024, the average monthly observed sales per customer at Uber was $107, a 6 percent increase year-over-year and a 17 percent increase from March 2022. Meanwhile, the average observed sales per customer at Lyft in March 2024 was $95, 5 percent higher than in March 2023 and 8 percent higher than in March 2022.
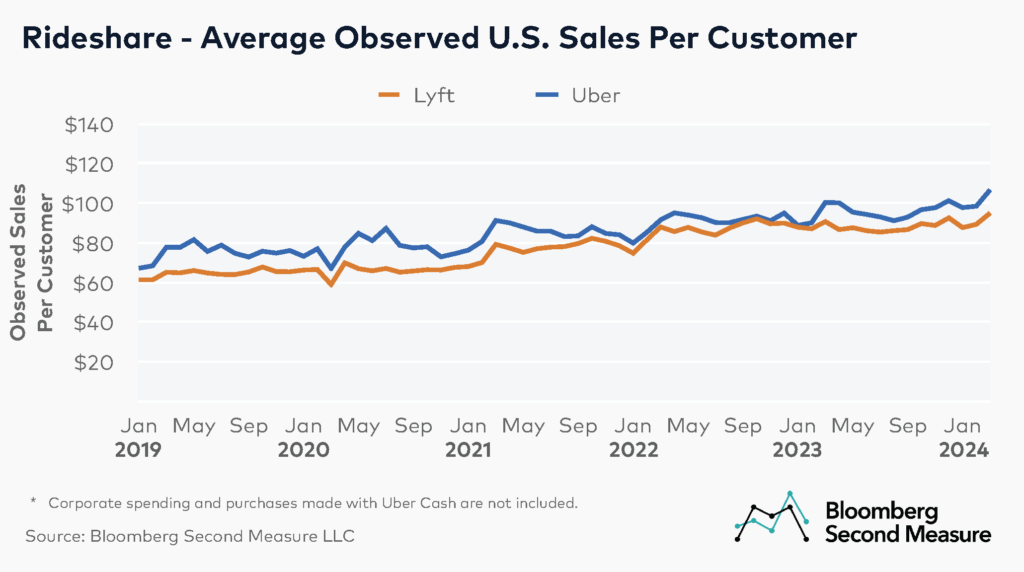
Looking at annual patterns, both companies typically see a dip in per-customer spending during the winter months, followed by a spike in either late winter or early spring. In 2024, average observed sales per customer at Uber increased 6 percent between February and March, while at Lyft, average observed sales per customer increased 5 percent over the same period.
Lyft and Uber have continued rolling out new offerings in the U.S.
In recent years, Uber expanded its offering beyond ridesharing. Apart from meal delivery, the company expanded its services in the U.S. into delivery across various categories, including groceries, alcohol, and packages. Additionally, in November 2021, Uber launched its new “Uber One” membership, which offers premium benefits for both rides and delivery services. Uber also launched Uber Explore in select cities in March 2022, giving consumers the option to book experiences like dinner reservations or live events through the app. Uber has also partnered with Waymo to offer some of its ridesharing and food delivery services utilizing Waymo’s self-driving cars. The first phase of the partnership is set to launch in the Phoenix Metro area by the end of 2023.
In November 2021, Lyft also entered the food delivery space through a partnership with Olo, aiming to be a last-mile delivery provider for restaurants currently using Olo’s Dispatch software. At the same time, the company continues to roll out new rideshare-related features. In May 2023, Lyft introduced a car pre-order option to streamline airport pickups.
Whether such new features and services put rideshare companies on the road to success is yet to be seen.
Bloomberg Second Measure launched a new and exclusive transaction dataset in July 2022. Our data continues to be broadly representative of U.S. consumers. As a result of this panel change, however, we recommend using only the latest posts in assessing metrics, and do not support referring to historical blog posts to infer period-over-period comparisons.
The data included in these materials are for illustrative purposes only. The Bloomberg Second Measure services are made available by Bloomberg Second Measure LLC (“BBSM”). BBSM’s parent company, Bloomberg L.P. (“BLP”), provides BBSM with global marketing and operational support. Nothing in the Services shall constitute or be construed as an offering of financial instruments by BBSM, BLP or their affiliates, or as investment advice or recommendations by BBSM, BLP or their affiliates of an investment strategy or whether or not to “buy”, “sell” or “hold” an investment. BLOOMBERG, BLOOMBERG SECOND MEASURE, BLOOMBERG TERMINAL, BLOOMBERG PROFESSIONAL, BLOOMBERG MARKETS, BLOOMBERG NEWS, BLOOMBERG TRADEBOOK, BLOOMBERG BONDTRADER, BLOOMBERG TELEVISION, BLOOMBERG RADIO, BLOOMBERG.COM and BLOOMBERG ANYWHERE are trademarks and service marks of Bloomberg Finance L.P., a Delaware limited partnership, or its subsidiaries. Absence of any trademark or service mark from this list does not waive Bloomberg Finance L.P.’s or its affiliates’ intellectual property rights in that name, mark or logo. All rights reserved. © 2023 Bloomberg.