In recent years, Krispy Kreme Inc (NASDAQ: DNUT) debuted a range of products at higher price points such as fritters, cinnamon rolls, and hand-cut doughnuts. This is in line with the emerging trend dubbed premiumization, as companies across various industries increasingly put an emphasis on higher-priced products in order to increase profit margins. Ahead of Krispy Kreme Inc’s FY23 Q1 earnings call, Bloomberg Second Measure’s consumer transaction data shows that so far in 2023, the company’s U.S. average monthly sales per customer has grown at a double-digit pace year-over-year, continuing the trend seen throughout most of 2022. Additionally, we found that transactions of $30.00 and above made up a larger share of Krispy Kreme Inc’s U.S. sales in early 2023 than in the comparable periods of 2021 and 2022.
Krispy Kreme Inc (NASDAQ: DNUT) saw a double-digit increase in average monthly U.S. sales per customer in March 2023 compared to previous years
Consumer transaction data shows that in March 2023, the average monthly U.S. sales per customer at Krispy Kreme Inc (which, apart from its namesake brand, includes Insomnia Cookies) was $26. Compared to March 2022, average monthly per-customer spending at Krispy Kreme Inc increased 13 percent.
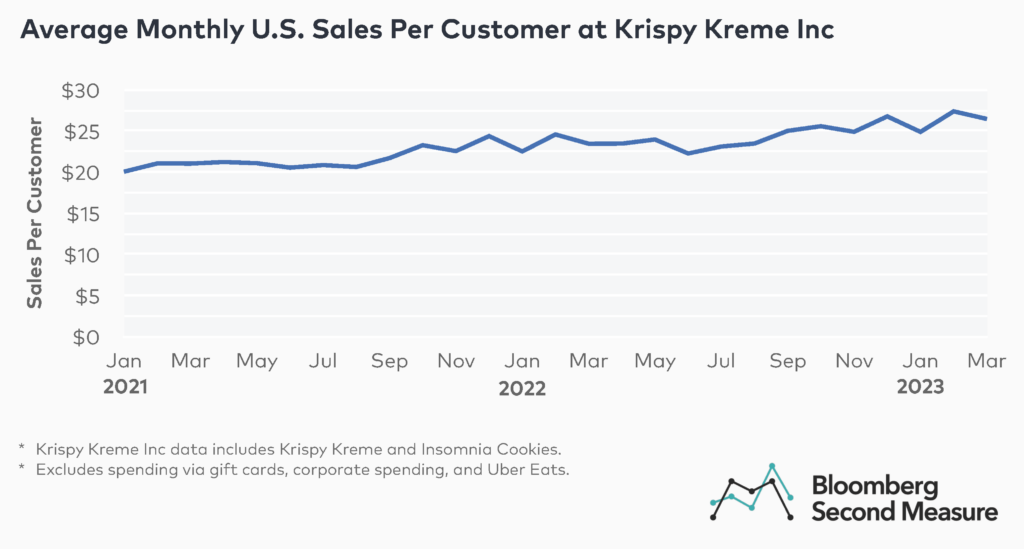
Krispy Kreme Inc’s double-digit year-over-year growth in the average sales per customer in March 2023 continued the trend seen throughout most of 2022 and the first two months of 2023. In most months during that period, the average U.S. sales per customer grew over 10 percent year-over-year, with record months February 2022 and September 2022 up 17 percent and 16 percent, respectively.
When comparing March 2023 to March 2021, Krispy Kreme Inc’s average sales per customer increased 26 percent. Similarly, in February and January of 2023, per-customer spending increased 30 and 24 percent, respectively, compared to the same months in 2021.
Soaring inflation, which impacted a range of sectors—from discount chains to grocery companies—might be one possible explanation for the growth in the U.S. per-customer spending at Krispy Kreme Inc. Another possible factor might be the wider availability of higher-priced products on Krispy Kreme Inc’s menu. In September 2021, Krispy Kreme Inc tested the waters of adding premium items to its menu by introducing cinnamon rolls for a limited time, while in August 2022, the company introduced pricier hand-cut doughnuts. Additionally, the company launched premium seasonal offerings such as a special collection for Valentine’s Day 2022 and apple fritters in September 2022.
Notably, during Krispy Kreme Inc’s FY22 Q4 earnings call, the company cited such seasonal premium additions as one of the drivers of the doughnut chain’s growth. During the call, company executives also stated that continued focus on premium doughnuts and limiting discounts, such as the Beat the Pump promotion, are part of Krispy Kreme Inc’s growth plan for 2023.
The share of Krispy Kreme Inc’s U.S. sales that came from transactions of $30.00 and above increased between March 2021 and March 2023
Taking a closer look at Krispy Kreme Inc’s transaction spend bands in March 2023, transactions between $10.00 and $19.99, at 37 percent, accounted for the biggest share of Krispy Kreme Inc’s U.S. sales. Meanwhile, 34 percent of the company’s March 2023 sales came from transactions of $30.00 and above, 20 percent from transactions between $20.00 and $29.99, and 9 percent from transactions of $9.99 and below.
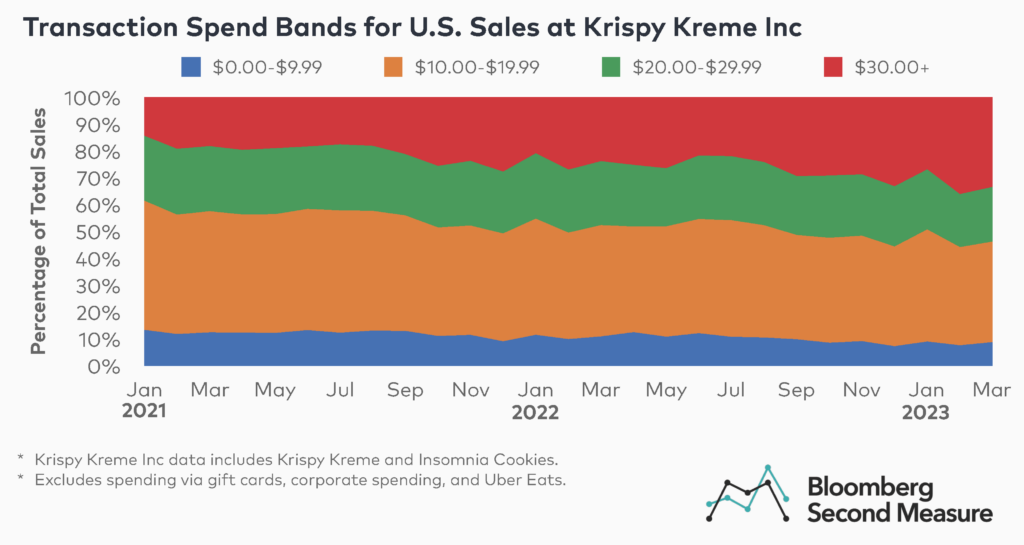
Throughout 2021 and 2022, as well as the first two months of 2023, the biggest portion of Krispy Kreme Inc’s monthly U.S. sales also came from transactions between $10.00 and $19.99. However, their share of the company’s U.S. sales decreased slightly over that period. Transactions between $10.00 and $19.99 accounted for 45 percent of Krispy Kreme Inc’s sales in March 2021 and 41 percent in March 2022.
At the same time, the share of Krispy Kreme Inc’s U.S. sales that came from transactions of $30.00 and above increased. In March 2021, transactions of $30.00 and above accounted for 18 percent of Krispy Kreme Inc’s U.S. sales, whereas in March 2022, their share increased to 23 percent. Notably, in each month since September 2022, transactions of $30.00 and above accounted for over 25 percent of the company’s U.S. sales.
Bloomberg Second Measure launched a new and exclusive transaction dataset in July 2022. Our data continues to be broadly representative of U.S. consumers. As a result of this panel change, however, we recommend using only the latest post in assessing metrics, and do not support referring to historical blog posts to infer period-over-period comparisons.