NOTE: Bloomberg Second Measure launched a new and exclusive transaction dataset in July 2022. Our data continues to be broadly representative of U.S. consumers. As a result of this panel change, however, we recommend using only the latest posts in assessing metrics, and do not support referring to historical blog posts to infer period-over-period comparisons.
As some U.S. employers consider expanding the role of telework at their companies, many Americans may be working remotely indefinitely and have the freedom to flee COVID-19 hot zones in favor of greener pastures. By using grocery spending as a proxy for residency, transaction data reveals which of the states hardest hit by the pandemic are most likely to see residents leaving—and where they might be headed.
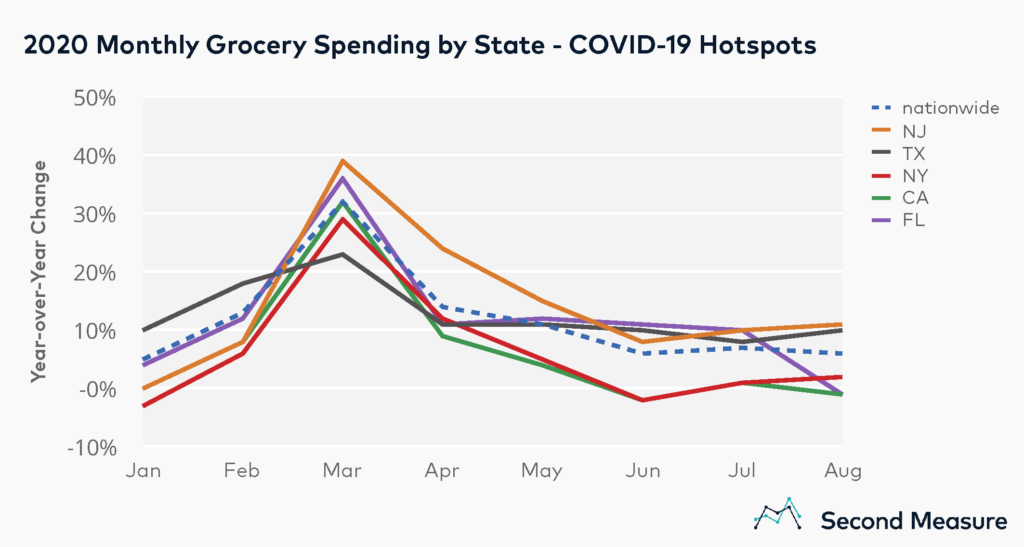
Data from Johns Hopkins points to five states where coronavirus outbreaks have been most severe: New York, New Jersey, Texas, California, and Florida. By contrasting the year-over-year change in grocery sales in these five states against a national benchmark, transaction data points to two states where pandemic grocery sales have been consistently below average: New York and California.

In New York, monthly grocery spending dramatically departed from national trends beginning in May and remained low throughout the summer months, suggesting a migration offset slightly from the April peak in new cases. Grocery sales were lowest relative to the national benchmark in June, when average spending in New York was down 2 percent year-over-year. Since June, sales have been growing again, suggesting some migrants may be returning. But the August year-over-year change in spending still remained 4 percentage points lower than the national benchmark of 6 percent growth.
On the other coast, Californians’ grocery spending follows a similar trajectory, with year-over-year change in sales falling 6 to 8 percentage points below the national benchmark from May through August. Unlike New York, August data continues to show a decline in year-over-year spending, down 1 percent.
Meanwhile, in Texas and New Jersey, the year-over-year changes in grocery sales have exceeded the national benchmark from May through August, suggesting more people may actually be relocating to these locations than away from them.
Unemployment and other considerations
Migration is not the only variable tipping the grocery scales. As an unemployment crisis impacts millions across the U.S., the July expiration of enhanced benefits placed an additional hardship on many Americans and is believed to be a factor in declining sales. This may be visible in Florida’s grocery sales trends, which exceeded the national benchmark from May through July but took a turn in August, falling 11 percentage points month-over-month.
Additionally, New York City is known to empty out in the summertime, another possible factor in the Empire state’s declining grocery sales. Although NYC migrants aren’t necessarily headed out of state since, this year in particular‚ rentals in the Hamptons are still reportedly booming late in the season.
Lastly, some of the observed decline in spending at grocery stores may be absorbed by players in the grocery delivery space—like Instacart and Peapod—which have become desirable alternatives to in-person shopping and were excluded from this grocery industry analysis. While year-over-year spending at these services has more than doubled, average daily spending for delivery services in August 2020 was still less than 15 percent of grocery industry sales. Furthermore, a shift to online grocery orders would not account for the rise in spending seen in some nearby states.
Vermont, Arizona see strong gains in grocery spending
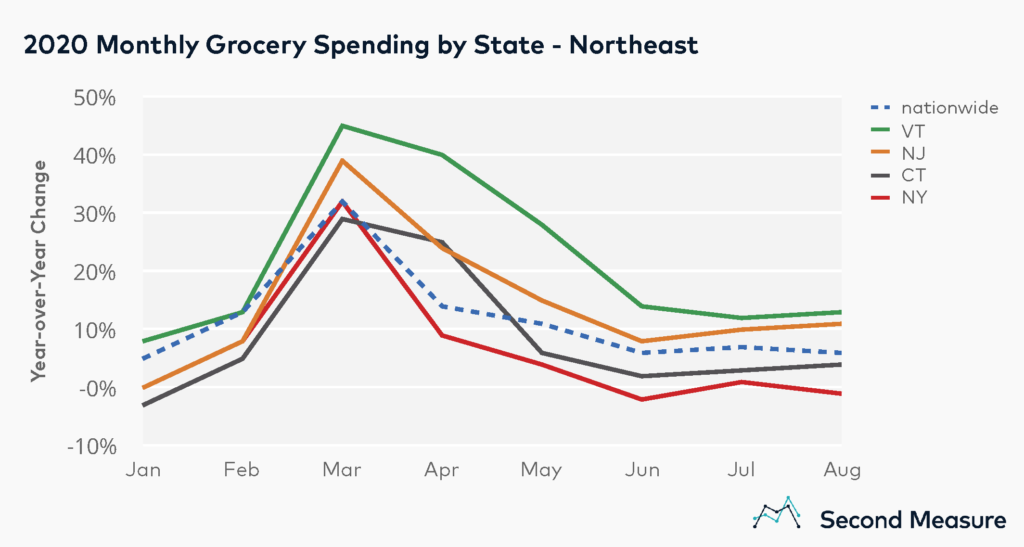
As New Yorkers head to the outskirts of the Tri-State area, there’s little evidence in grocery sales to suggest migration to Connecticut, where spending since May has been slightly positive year-over-year, but still 2 to 4 percentage points lower than the national benchmark. Grocery data suggests that New Jersey—despite its high volume of coronavirus cases—appears to be the bigger draw for relocation.

But one New England state may be luring New Yorkers north of the Tri-State. Vermont’s August grocery sales were up 13 percent over the year prior. The increase first began in March, when grocery spending was up 45 percent year-over-year. The spike’s origin in March suggests that winter ski homes may have been an obvious retreat for city-dwellers early in the pandemic. At the same time, nationwide spending also rose 32 percent, as stockpilers swept the shelves at grocers and wholesalers alike.
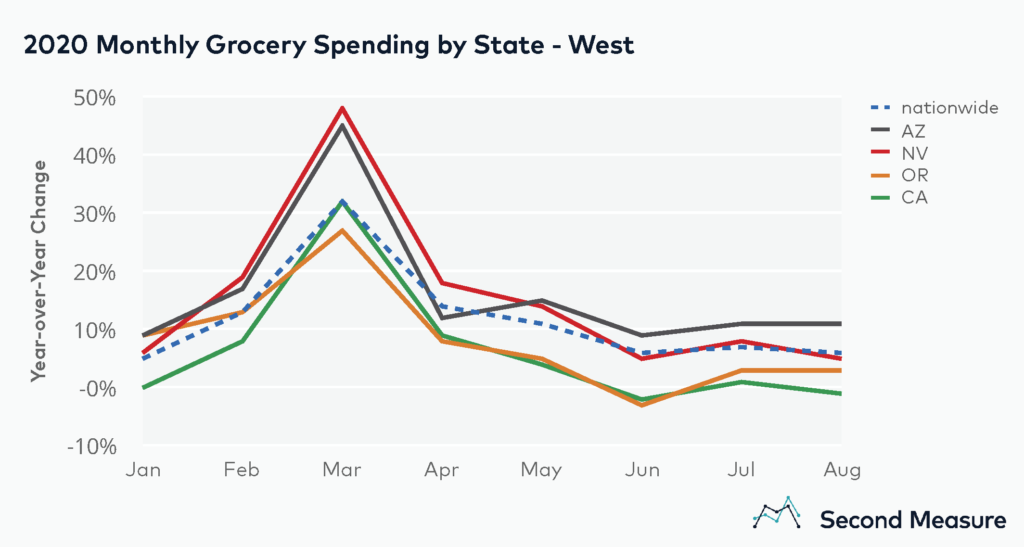
On the West Coast, grocery data does not suggest California’s drop in spending is being absorbed by its northern neighbor. Oregon’s grocery sales have been trending below the national average throughout the pandemic, though year-over-year spending did shift positive in July and August.
Though both Nevada and Arizona saw elevated grocery spending in February and March, Arizona alone sustained sales above the national benchmark from May through August. While Californians spent slightly less year-over-year on August groceries, spending in Arizona grew 11 percent.

Adjacent state analyses provide helpful clues around how COVID-19 has driven migration within the U.S. While some Americans may be escaping pandemic epicenters and high costs of living, many may continue to explore options for where to call home, as public health guidelines and corporate policies continue to adapt.
