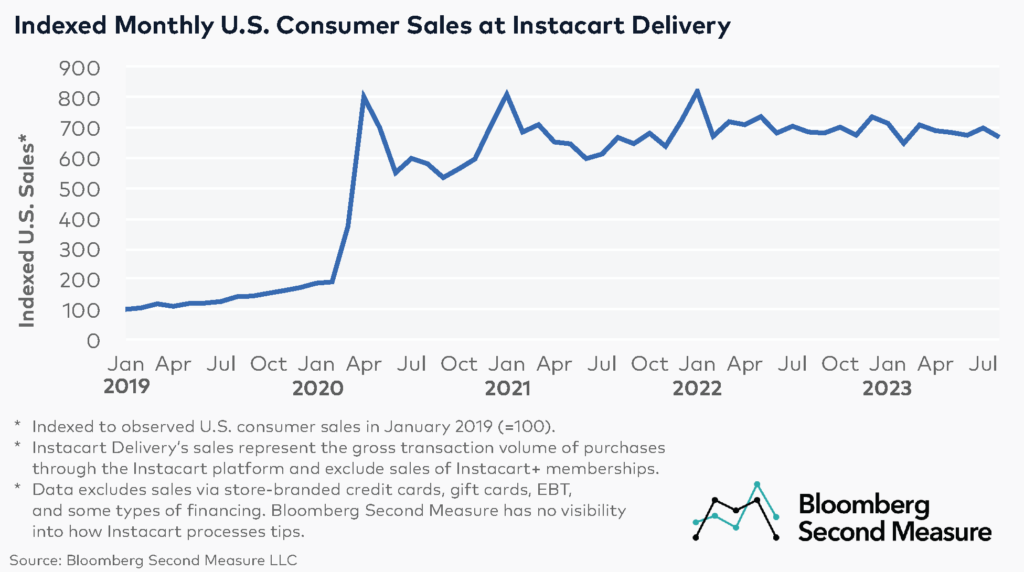
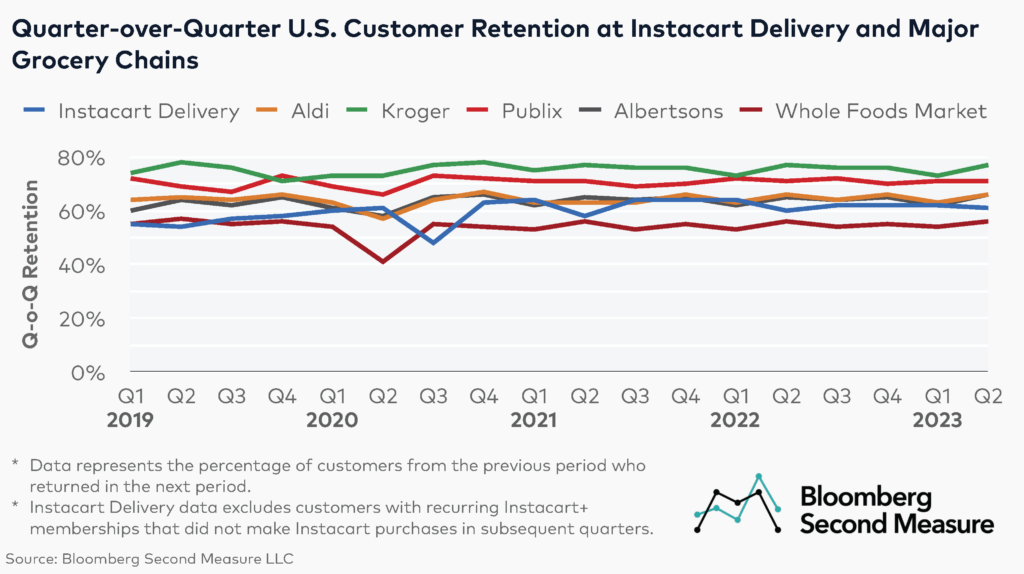
On September 18, 2023, after many months of anticipation, Instacart (NASDAQ: CART) went public. Bloomberg Second Measure’s consumer transaction data analytics show that in the months leading up to Instacart’s IPO, Instacart Delivery’s U.S. sales remained elevated compared to levels seen both pre-pandemic and early in the pandemic, but its year-over-year sales growth slowed. The data also shows that, while Instacart Delivery’s quarter-over-quarter customer retention rate in Q2 2023 was higher than before the pandemic and early in the pandemic, it was below the retention levels seen by most major U.S. grocery chains, including Aldi, Albertsons, and Kroger.
Instacart’s (NASDAQ: CART) U.S. grocery delivery sales decreased year-over-year in August 2023, but remained elevated compared to pre-pandemic and early pandemic levels
Our data analytics show that Instacart Delivery’s observed U.S. sales in August 2023 decreased 2 percent year-over-year and were roughly at the same level as in August 2021. It is worth noting that Instacart Delivery observed sales in this analysis represent the gross transaction volume of purchases through the Instacart platform and exclude sales of Instacart+ memberships.

The year-over-year decrease in Instacart’s observed grocery delivery sales seen in August 2023 is a continuation of the trend seen since the beginning of the year. So far in 2023, Instacart’s U.S. grocery delivery sales have experienced single-digit decreases year-over-year during most months.
However, Instacart Delivery’s observed U.S. sales remained elevated compared to levels seen pre-pandemic and early in the pandemic. Between August 2019 and August 2023, Instacart’s U.S. grocery delivery sales increased 372 percent. Meanwhile, between August 2020 and August 2023, its grocery delivery sales rose 15 percent.
Notably, Instacart’s observed grocery delivery sales skyrocketed early in the pandemic. After the initial year-over-year sales spike in March 2020, Instacart Delivery experienced triple-digit year-over-year sales growth in each month of 2020 and the first two months of 2021. Following that, Instacart saw single-digit and double-digit year-over-year sales growth during most months of 2021 and 2022.
Instacart Delivery’s quarter-over-quarter U.S. customer retention rate increased in Q2 2023 compared to pre-pandemic and early pandemic levels, but was lower than that of most major grocery chains
In Q2 2023, Instacart Delivery’s quarter-over-quarter U.S. customer retention was 61 percent. Instacart’s retention rate remained relatively unchanged compared to Q1 2023 and most quarters of 2022, but it was higher than its customer retention rates seen throughout most quarters of 2020 and 2019.

However, Instacart’s quarter-over-quarter retention in Q2 2023 was lower than that of most major U.S. grocery chains. Kroger saw 77 percent of its customers that shopped in Q1 2023 return in the subsequent quarter, while Publix’s customer retention rate over the same period was 71 percent. Meanwhile, both Albertsons and Aldi had a quarter-over-quarter retention rate of 66 percent in Q2 2023. On the other hand, Whole Foods Market’s retention rate in Q2 2023 was below Instacart’s, at 56 percent.
Between 2020 and 2022, Instacart’s quarter-over-quarter customer retention was below Kroger’s and Publix’s, but in some quarters it was higher than Albertson’s and Aldi’s. Compared to Whole Foods Market, Instacart’s customer retention was higher in most quarters over the same period.
Instacart searches for growth recipe
While replicating the massive sales spike seen in early 2020 might be difficult, in recent years, Instacart launched several initiatives aimed at boosting its revenue. These include expanding its ads business, as well as introducing AI-powered solutions for Instacart’s customers and grocery partners. The company also enlisted the help of renowned chefs and pop stars, including singer Lizzo, to create celebrity-inspired shopping lists.
Bloomberg Second Measure launched a new and exclusive transaction dataset in July 2022. Our data continues to be broadly representative of U.S. consumers. As a result of this panel change, however, we recommend using only the latest post in assessing metrics, and do not support referring to historical blog posts to infer period-over-period comparisons.
The data included in these materials are for illustrative purposes only. The Bloomberg Second Measure services are made available by Bloomberg Second Measure LLC (“BBSM”). BBSM’s parent company, Bloomberg L.P. (“BLP”), provides BBSM with global marketing and operational support. Nothing in the Services shall constitute or be construed as an offering of financial instruments by BBSM, BLP or their affiliates, or as investment advice or recommendations by BBSM, BLP or their affiliates of an investment strategy or whether or not to “buy”, “sell” or “hold” an investment. BLOOMBERG, BLOOMBERG SECOND MEASURE, BLOOMBERG TERMINAL, BLOOMBERG PROFESSIONAL, BLOOMBERG MARKETS, BLOOMBERG NEWS, BLOOMBERG TRADEBOOK, BLOOMBERG BONDTRADER, BLOOMBERG TELEVISION, BLOOMBERG RADIO, BLOOMBERG.COM and BLOOMBERG ANYWHERE are trademarks and service marks of Bloomberg Finance L.P., a Delaware limited partnership, or its subsidiaries. Absence of any trademark or service mark from this list does not waive Bloomberg Finance L.P.’s or its affiliates’ intellectual property rights in that name, mark or logo. All rights reserved. © 2023 Bloomberg.
