Some cruise lines, including Norwegian (NYSE: NCLH) and Royal Caribbean (NYSE: RCL), have started setting sail again after being on hiatus throughout the pandemic. The cruise industry is one of the many areas within the travel sector—such as airlines, rental cars, and hospitality—that have been rebounding over the summer. Royal Caribbean and Viking River Cruises in particular have captured market share in the two years from July 2019 to July 2021. However, despite a recent uptick, sales for the cruise line industry remain far below pre-pandemic levels.
Cruise industry sales are slowly bouncing back
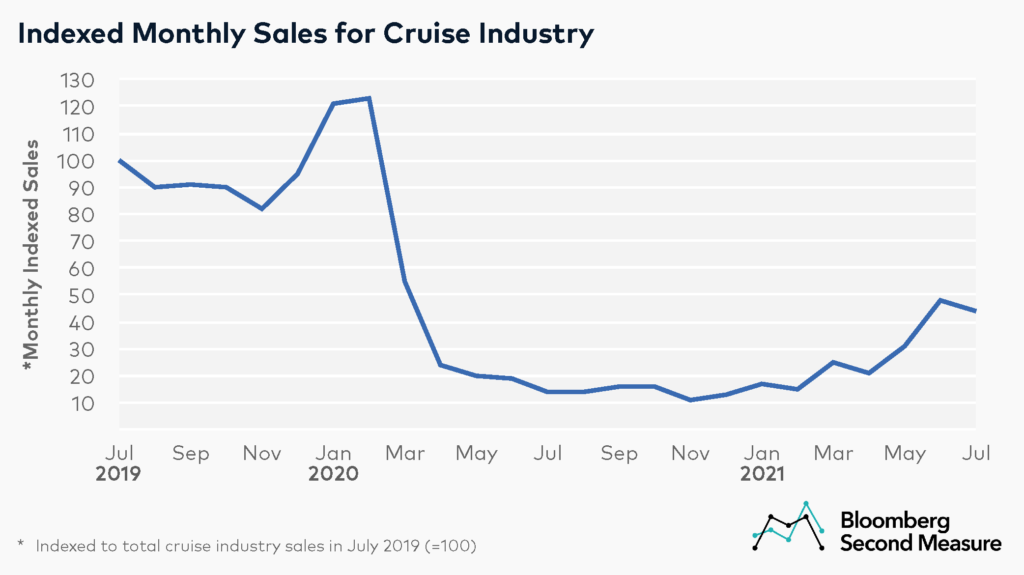
Major cruise lines paused operations early in the pandemic, after multiple outbreaks aboard cruise ships. Industry sales dropped 55 percent from February to March 2020, and then another 57 percent between March and April 2020. As COVID-19 vaccines became available, cruise sales started to rise again in March 2021, increasing 71 percent month-over-month, and have generally trended upward in the second quarter of 2021. However, while cruise sales are 223 percent higher year-over-year as of July 2021, they are still 56 percent lower than they were in July 2019.

Notably, Bloomberg Second Measure only captures U.S. consumer sales and excludes international spending. Sales are also counted when the cruise is booked, not the month in which the cruise occurs.
Viking River Cruises and Royal Caribbean gained market share between July 2019 and July 2021
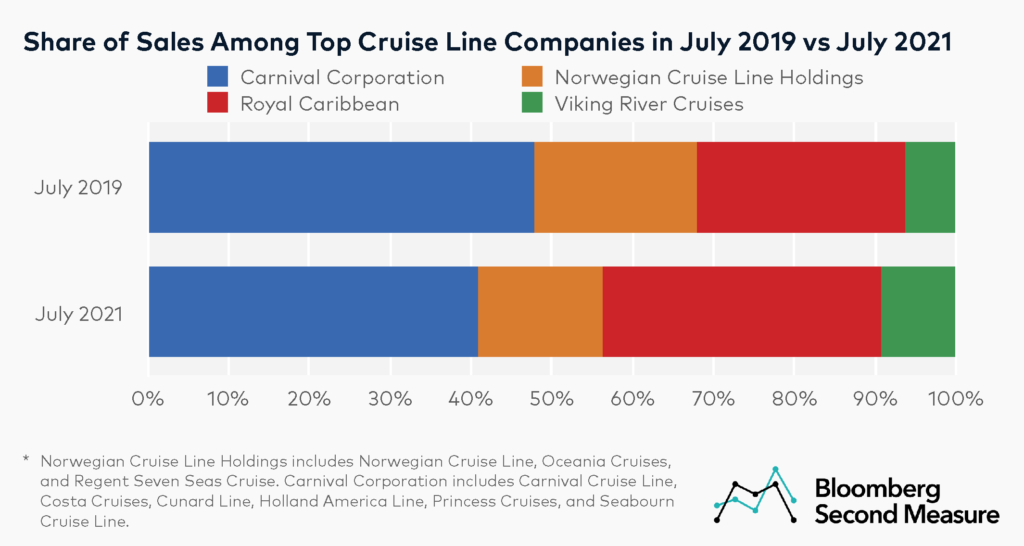
Viking River Cruises and Royal Caribbean have gained market share among top cruise line companies over the past two years. Between July 2019 and July 2021, Viking River Cruises’ share of sales among the four major cruise line holding companies grew from 6 percent to 9 percent. Despite this growth, it still had the lowest share of sales as of July 2021. Royal Caribbean saw its share of sales grow from 26 percent to 34 percent in the same time frame.

Carnival Corporation (NYSE: CCL) remains the largest cruise line company within the set, with 41 percent of sales among this chosen competitive set in July 2021. However, its market share declined from 48 percent in July 2019. Similarly, Norwegian Cruise Line Holdings’ share of sales decreased 5 percentage points over the last two years.
Most of Viking River Cruises’ market share gains came at the expense of Carnival
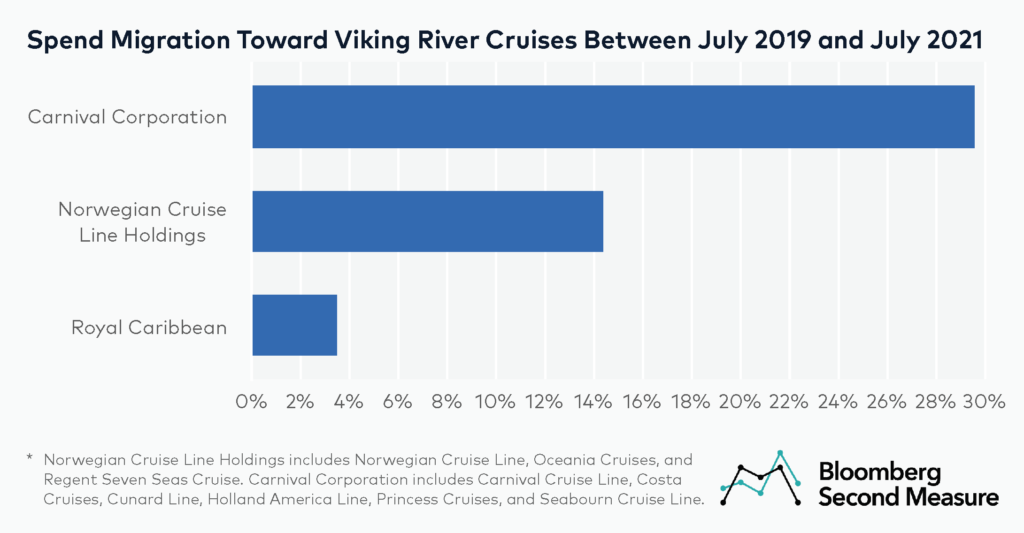
Spend migration data identifies which competitors contributed the most to Viking River Cruises’ market share growth between July 2019 and July 2021. Most of Viking River Cruises’ relative share growth—or growth rate of market share—came at the expense of Carnival Corporation, with moderate gains also coming from Norwegian Cruise Line Holdings. Royal Caribbean accounted for a much smaller portion of Viking River Cruises’ relative share growth.

Viking River Cruises also has the highest transaction values
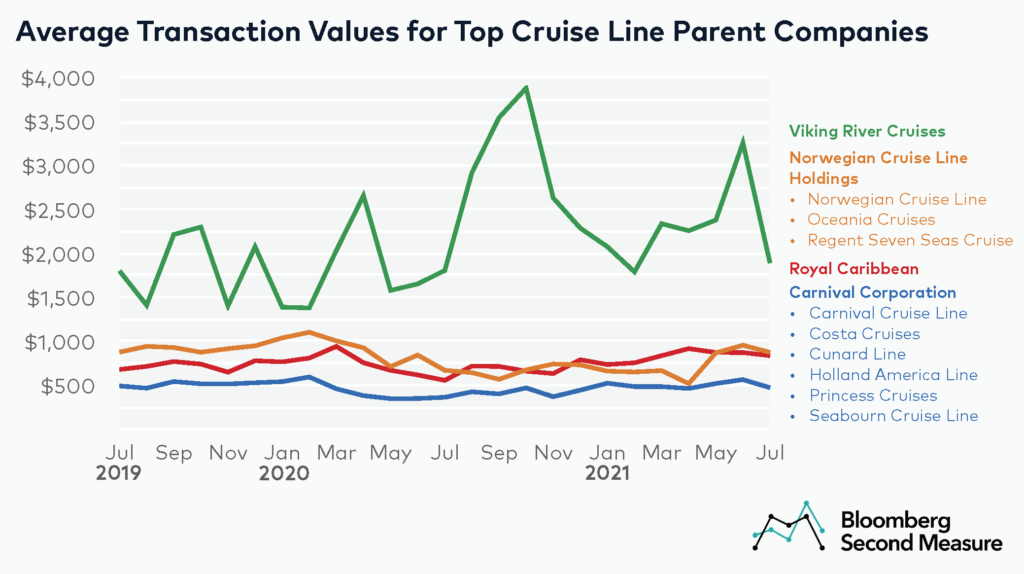
In addition to seeing an increase in share of sales, Viking River Cruises has the highest average transaction value—more than double that of its nearest competitor, Norwegian Cruise Line Holdings. In July 2021, the average transaction value for Viking River Cruises was $1,892, compared to $875 for Norwegian, $837 for Royal Caribbean, and $472 for Carnival Corporation.

While average transaction values have remained fairly steady for Royal Caribbean and Carnival Corporation over the past two years, Viking River Cruises has experienced notable spikes in average transaction value, especially in October 2020 and June 2021. Viking River Cruises offers the option of bundling airfare with the cruise, which could partially account for its higher price point as well as the variations in average transaction value.
*Note: Bloomberg Second Measure regularly refreshes its panel and methods in order to provide the highest quality data that is broadly representative of U.S. consumers. As a result, we may restate historical data, including our blog content.
